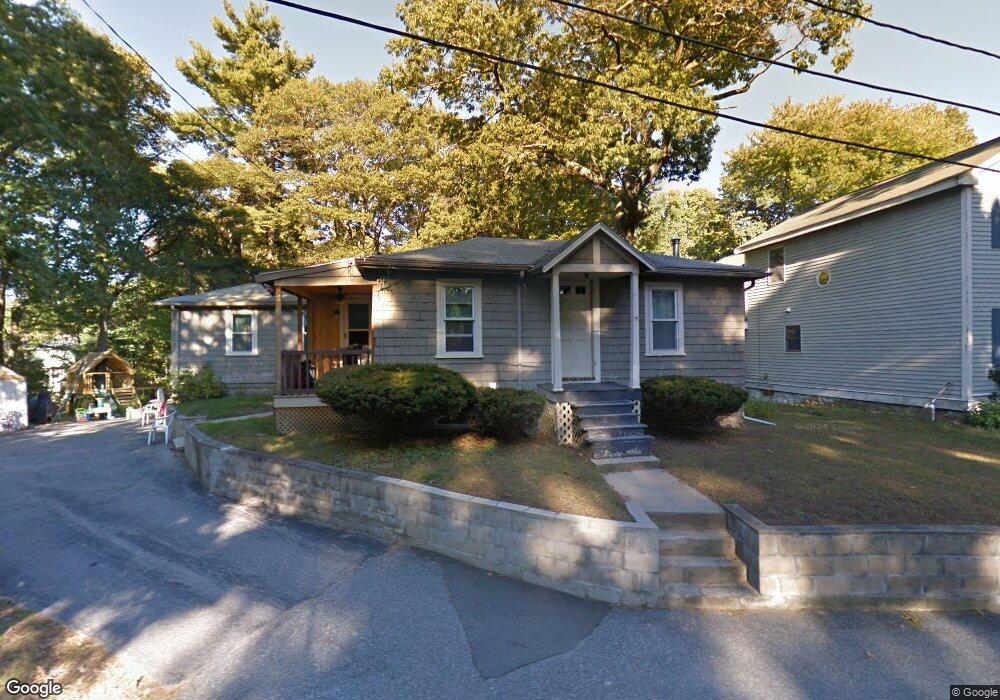
17 Dunbar Rd Reading, MA 01867
Estimated Value: $628,000 - $954,000
4
Beds
1
Bath
1,147
Sq Ft
$703/Sq Ft
Est. Value
About This Home
This home is located at 17 Dunbar Rd, Reading, MA 01867 and is currently estimated at $806,316, approximately $702 per square foot. 17 Dunbar Rd is a home located in Middlesex County with nearby schools including Birch Meadow Elementary School, Arthur W. Coolidge Middle School, and Reading Memorial High School.
Ownership History
Date
Name
Owned For
Owner Type
Purchase Details
Closed on
Jul 2, 2013
Sold by
Cantillon Patricia
Bought by
Cantillon Tamara and Cantillon Thomas P
Current Estimated Value
Purchase Details
Closed on
Apr 16, 2010
Sold by
Harrison David Est and Leger
Bought by
Cantillon Tamara and Cantillon Patricia
Home Financials for this Owner
Home Financials are based on the most recent Mortgage that was taken out on this home.
Original Mortgage
$259,538
Interest Rate
4.97%
Mortgage Type
Purchase Money Mortgage
Create a Home Valuation Report for This Property
The Home Valuation Report is an in-depth analysis detailing your home's value as well as a comparison with similar homes in the area
Home Values in the Area
Average Home Value in this Area
Purchase History
| Date | Buyer | Sale Price | Title Company |
|---|---|---|---|
| Cantillon Tamara | -- | -- | |
| Cantillon Tamara | $268,500 | -- |
Source: Public Records
Mortgage History
| Date | Status | Borrower | Loan Amount |
|---|---|---|---|
| Previous Owner | Cantillon Tamara | $259,538 |
Source: Public Records
Tax History Compared to Growth
Tax History
| Year | Tax Paid | Tax Assessment Tax Assessment Total Assessment is a certain percentage of the fair market value that is determined by local assessors to be the total taxable value of land and additions on the property. | Land | Improvement |
|---|---|---|---|---|
| 2025 | $7,967 | $699,500 | $442,200 | $257,300 |
| 2024 | $7,876 | $672,000 | $424,800 | $247,200 |
| 2023 | $7,630 | $606,000 | $383,000 | $223,000 |
| 2022 | $8,243 | $618,400 | $348,200 | $270,200 |
| 2021 | $10,338 | $748,600 | $333,700 | $414,900 |
| 2020 | $9,937 | $712,300 | $317,500 | $394,800 |
| 2019 | $6,174 | $433,900 | $302,400 | $131,500 |
| 2018 | $5,676 | $409,200 | $285,200 | $124,000 |
| 2017 | $1,362 | $386,100 | $269,100 | $117,000 |
| 2016 | $4,269 | $294,400 | $198,900 | $95,500 |
| 2015 | $4,123 | $280,500 | $189,500 | $91,000 |
| 2014 | $3,776 | $256,200 | $180,400 | $75,800 |
Source: Public Records
Map
Nearby Homes
- 25 Martin Rd
- 28 Martin Rd
- 33 Marla Ln
- 483 Franklin St
- 23 Covey Hill Rd
- 42 Winthrop Ave
- 195 Lowell St
- 863 Main St
- 444 Lowell St
- 3 Bradford Rd
- 52 Sanborn St Unit 408
- 77 Mount Vernon St
- 11 Clover Cir Unit A
- 103 High St
- 52 Salem St
- 8 Partridge Rd
- 5 Washington St Unit B2
- 0 Charles St Unit 72374573
- 17 Palmer Hill Ave
- 409 Haverhill St