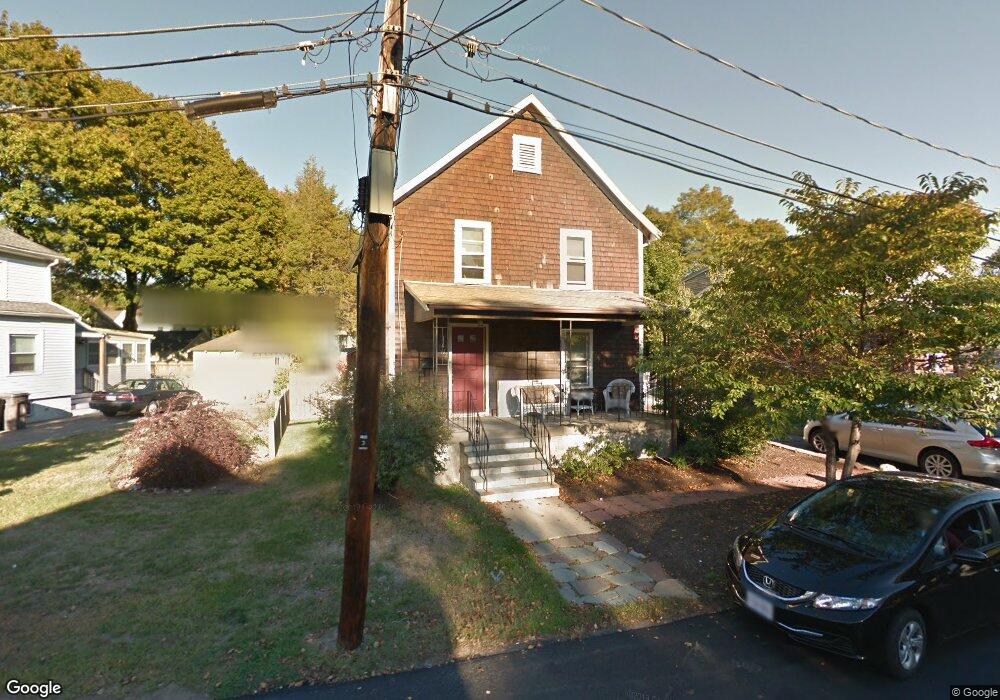
17 Dyer St Framingham, MA 01702
Estimated Value: $523,835 - $577,000
4
Beds
1
Bath
1,344
Sq Ft
$410/Sq Ft
Est. Value
About This Home
This home is located at 17 Dyer St, Framingham, MA 01702 and is currently estimated at $551,209, approximately $410 per square foot. 17 Dyer St is a home located in Middlesex County with nearby schools including Framingham High School, Christa McAuliffe Charter School, and Happy Hollow School.
Ownership History
Date
Name
Owned For
Owner Type
Purchase Details
Closed on
Aug 31, 2004
Sold by
Tomassini Paul and Tomassini Ralph E
Bought by
Gusman-Peres Maria C
Current Estimated Value
Home Financials for this Owner
Home Financials are based on the most recent Mortgage that was taken out on this home.
Original Mortgage
$240,000
Outstanding Balance
$120,011
Interest Rate
6.02%
Mortgage Type
Purchase Money Mortgage
Estimated Equity
$431,198
Create a Home Valuation Report for This Property
The Home Valuation Report is an in-depth analysis detailing your home's value as well as a comparison with similar homes in the area
Home Values in the Area
Average Home Value in this Area
Purchase History
| Date | Buyer | Sale Price | Title Company |
|---|---|---|---|
| Gusman-Peres Maria C | $300,000 | -- | |
| Gusman-Peres Maria C | $300,000 | -- |
Source: Public Records
Mortgage History
| Date | Status | Borrower | Loan Amount |
|---|---|---|---|
| Open | Gusman-Peres Maria C | $240,000 | |
| Closed | Gusman-Peres Maria C | $240,000 |
Source: Public Records
Tax History
| Year | Tax Paid | Tax Assessment Tax Assessment Total Assessment is a certain percentage of the fair market value that is determined by local assessors to be the total taxable value of land and additions on the property. | Land | Improvement |
|---|---|---|---|---|
| 2025 | $4,848 | $406,000 | $218,000 | $188,000 |
| 2024 | $4,616 | $370,500 | $195,400 | $175,100 |
| 2023 | $4,413 | $337,100 | $175,100 | $162,000 |
| 2022 | $4,143 | $301,500 | $159,000 | $142,500 |
| 2021 | $4,027 | $286,600 | $152,900 | $133,700 |
| 2020 | $3,934 | $262,600 | $132,900 | $129,700 |
| 2019 | $3,840 | $249,700 | $129,100 | $120,600 |
| 2018 | $3,780 | $231,600 | $122,200 | $109,400 |
| 2017 | $3,626 | $217,000 | $118,800 | $98,200 |
| 2016 | $3,535 | $203,400 | $114,900 | $88,500 |
| 2015 | $3,601 | $202,100 | $115,000 | $87,100 |
Source: Public Records
Map
Nearby Homes
- 16 Grant Street Extension
- 260 Grant St
- 96 Mansfield St
- 47 Bishop Dr
- 132 Howe St Unit B
- 56 Morency St Unit D
- 15 Willis St Unit 4
- 50 Kittredge Rd
- 46 Cochituate Rd Unit 106
- 120 Franklin St
- 6 Woodward Rd
- 18 Beaver Ct
- 126 Beaver St Unit 5
- 54 Pilgrim Rd
- 33 Stevens Rd
- Lot 3 Murray Hill Rd
- 11 Village Rock Ln Unit 21
- 21 Village Rock Ln Unit 4
- 9 Village Hill Ln Unit 15
- 5 Village Rock Ln Unit 24
Your Personal Tour Guide
Ask me questions while you tour the home.