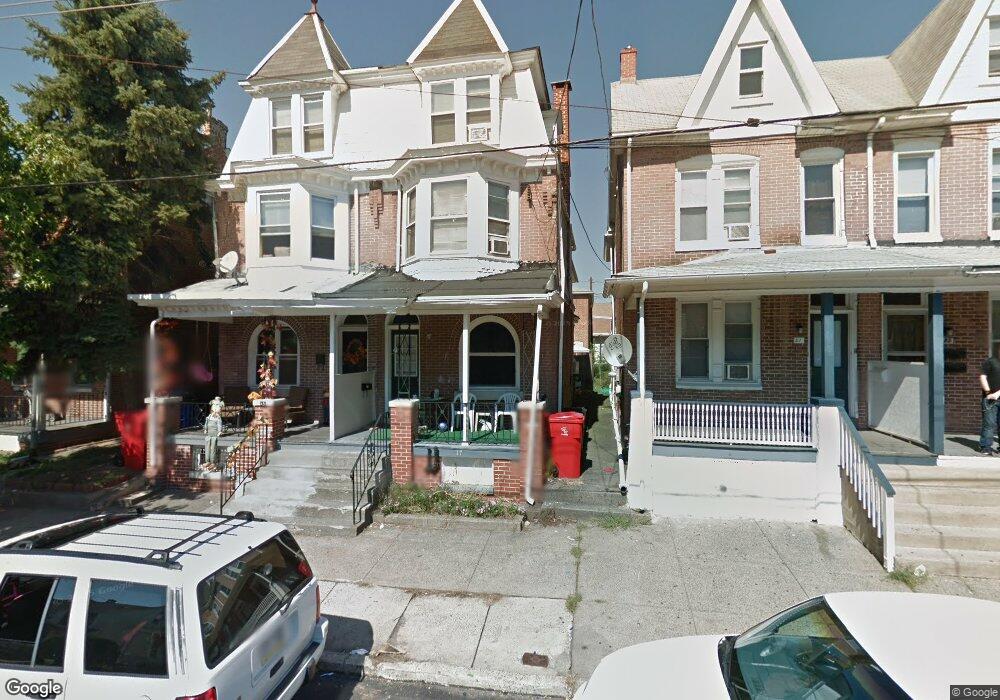
17 E 2nd St Pottstown, PA 19464
Manatawny-Farmington NeighborhoodEstimated Value: $198,000 - $240,609
4
Beds
1
Bath
2,150
Sq Ft
$102/Sq Ft
Est. Value
About This Home
This home is located at 17 E 2nd St, Pottstown, PA 19464 and is currently estimated at $220,152, approximately $102 per square foot. 17 E 2nd St is a home located in Montgomery County with nearby schools including Pottstown Middle School, Pottstown Senior High School, and West-Mont Christian Academy.
Ownership History
Date
Name
Owned For
Owner Type
Purchase Details
Closed on
Nov 5, 2010
Sold by
Adeni Kamal and Adeni Asha P
Bought by
Burns Robert and Severs Robbie
Current Estimated Value
Home Financials for this Owner
Home Financials are based on the most recent Mortgage that was taken out on this home.
Original Mortgage
$78,732
Outstanding Balance
$51,893
Interest Rate
4.25%
Mortgage Type
FHA
Estimated Equity
$168,259
Purchase Details
Closed on
Aug 30, 2004
Sold by
Bailey Ronald F
Bought by
Adeni Kamal and Adeni Asha P
Purchase Details
Closed on
Apr 25, 2000
Sold by
Hud
Bought by
Bailey Ronald F
Purchase Details
Closed on
Sep 3, 1999
Sold by
Norwest Mtg Inc
Bought by
Hud
Purchase Details
Closed on
Nov 28, 1994
Sold by
Martin Anthony W and Martin John A
Bought by
Byrne David P and Bender Sharon S
Create a Home Valuation Report for This Property
The Home Valuation Report is an in-depth analysis detailing your home's value as well as a comparison with similar homes in the area
Home Values in the Area
Average Home Value in this Area
Purchase History
| Date | Buyer | Sale Price | Title Company |
|---|---|---|---|
| Burns Robert | $91,900 | None Available | |
| Adeni Kamal | $86,000 | -- | |
| Bailey Ronald F | $32,000 | -- | |
| Hud | -- | -- | |
| Byrne David P | $77,000 | -- |
Source: Public Records
Mortgage History
| Date | Status | Borrower | Loan Amount |
|---|---|---|---|
| Open | Burns Robert | $78,732 | |
| Closed | Adeni Kamal | $0 |
Source: Public Records
Tax History
| Year | Tax Paid | Tax Assessment Tax Assessment Total Assessment is a certain percentage of the fair market value that is determined by local assessors to be the total taxable value of land and additions on the property. | Land | Improvement |
|---|---|---|---|---|
| 2025 | $3,805 | $62,000 | $25,870 | $36,130 |
| 2024 | $3,805 | $62,000 | $25,870 | $36,130 |
| 2023 | $3,754 | $62,000 | $25,870 | $36,130 |
| 2022 | $3,734 | $62,000 | $25,870 | $36,130 |
| 2021 | $3,691 | $62,000 | $25,870 | $36,130 |
| 2020 | $3,626 | $62,000 | $25,870 | $36,130 |
| 2019 | $3,543 | $62,000 | $25,870 | $36,130 |
| 2018 | $2,128 | $62,000 | $25,870 | $36,130 |
| 2017 | $3,313 | $62,000 | $25,870 | $36,130 |
| 2016 | $3,289 | $62,000 | $25,870 | $36,130 |
| 2015 | $3,268 | $62,000 | $25,870 | $36,130 |
| 2014 | $3,268 | $62,000 | $25,870 | $36,130 |
Source: Public Records
Map
Nearby Homes
Your Personal Tour Guide
Ask me questions while you tour the home.