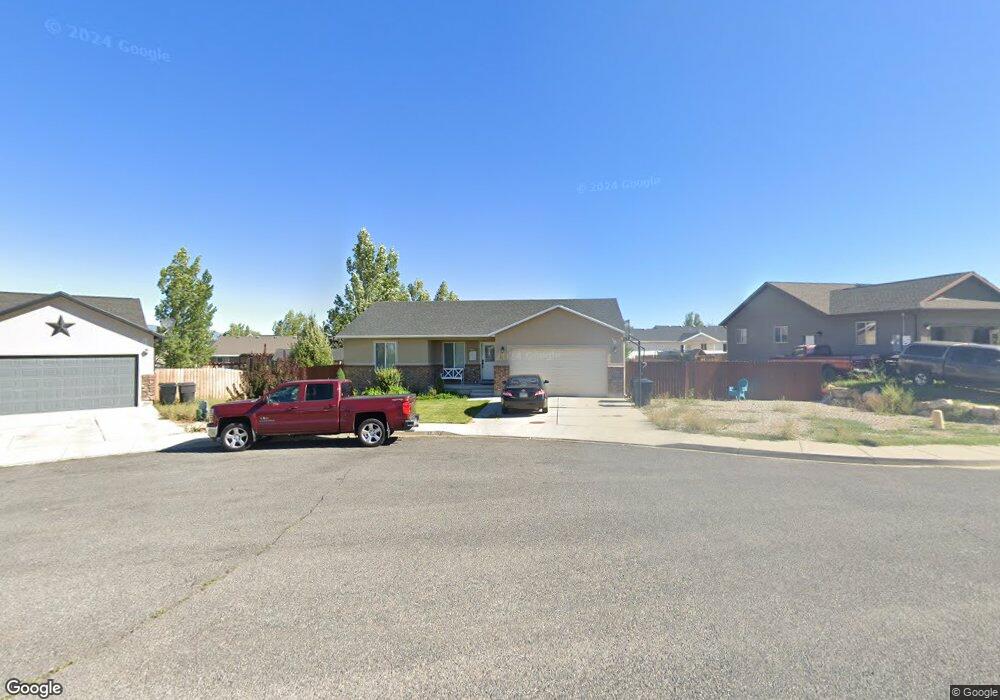
17 E 740 S Ephraim, UT 84627
Estimated Value: $411,000 - $516,000
5
Beds
3
Baths
2,464
Sq Ft
$183/Sq Ft
Est. Value
About This Home
This home is located at 17 E 740 S, Ephraim, UT 84627 and is currently estimated at $451,527, approximately $183 per square foot. 17 E 740 S is a home located in Sanpete County.
Ownership History
Date
Name
Owned For
Owner Type
Purchase Details
Closed on
Jun 3, 2020
Sold by
Nielsen Preston R and Nielsen Augusta C
Bought by
Cross Michael J
Current Estimated Value
Home Financials for this Owner
Home Financials are based on the most recent Mortgage that was taken out on this home.
Original Mortgage
$263,150
Outstanding Balance
$232,164
Interest Rate
3.3%
Mortgage Type
Construction
Estimated Equity
$219,363
Purchase Details
Closed on
Dec 21, 2009
Sold by
Ephraim City Housing Authority
Bought by
Hughes Tyler and Hughes Lisa
Create a Home Valuation Report for This Property
The Home Valuation Report is an in-depth analysis detailing your home's value as well as a comparison with similar homes in the area
Home Values in the Area
Average Home Value in this Area
Purchase History
| Date | Buyer | Sale Price | Title Company |
|---|---|---|---|
| Cross Michael J | $328,937 | First American-Ephraim | |
| Hughes Tyler | -- | -- |
Source: Public Records
Mortgage History
| Date | Status | Borrower | Loan Amount |
|---|---|---|---|
| Open | Cross Michael J | $263,150 |
Source: Public Records
Tax History
| Year | Tax Paid | Tax Assessment Tax Assessment Total Assessment is a certain percentage of the fair market value that is determined by local assessors to be the total taxable value of land and additions on the property. | Land | Improvement |
|---|---|---|---|---|
| 2025 | $2,378 | $230,409 | $0 | $0 |
| 2024 | $2,390 | $220,087 | $0 | $0 |
| 2023 | $2,358 | $206,655 | $0 | $0 |
| 2022 | $2,410 | $192,482 | $0 | $0 |
| 2021 | $2,336 | $161,225 | $0 | $0 |
| 2020 | $2,129 | $138,335 | $0 | $0 |
| 2019 | $2,010 | $128,494 | $0 | $0 |
| 2018 | $1,936 | $216,869 | $31,680 | $185,189 |
| 2017 | $1,525 | $98,361 | $0 | $0 |
| 2016 | $1,441 | $92,923 | $0 | $0 |
| 2015 | $1,448 | $92,923 | $0 | $0 |
| 2014 | $1,303 | $85,035 | $0 | $0 |
| 2013 | $1,297 | $85,035 | $0 | $0 |
Source: Public Records
Map
Nearby Homes
Your Personal Tour Guide
Ask me questions while you tour the home.