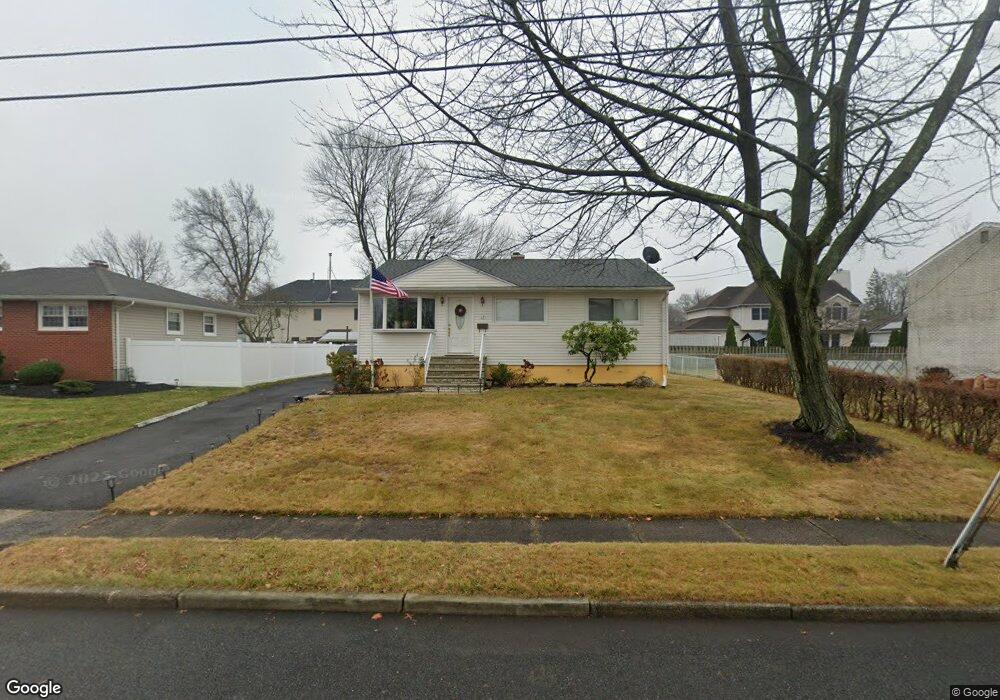
17 E Shirley Ave Colonia, NJ 07067
Estimated Value: $386,625 - $620,000
--
Bed
--
Bath
1,043
Sq Ft
$500/Sq Ft
Est. Value
About This Home
This home is located at 17 E Shirley Ave, Colonia, NJ 07067 and is currently estimated at $521,906, approximately $500 per square foot. 17 E Shirley Ave is a home located in Middlesex County with nearby schools including Oak Ridge Heights Elementary School, Colonia Middle School, and Colonia High School.
Ownership History
Date
Name
Owned For
Owner Type
Purchase Details
Closed on
Aug 31, 2005
Sold by
Casanova Avelino
Bought by
Perdiago Zelia
Current Estimated Value
Home Financials for this Owner
Home Financials are based on the most recent Mortgage that was taken out on this home.
Original Mortgage
$304,000
Outstanding Balance
$163,356
Interest Rate
5.92%
Estimated Equity
$358,550
Purchase Details
Closed on
Oct 1, 2004
Sold by
Rhem Jeffrey
Bought by
Casanova Avelino and Casanova Maria
Home Financials for this Owner
Home Financials are based on the most recent Mortgage that was taken out on this home.
Original Mortgage
$200,000
Interest Rate
5.71%
Create a Home Valuation Report for This Property
The Home Valuation Report is an in-depth analysis detailing your home's value as well as a comparison with similar homes in the area
Home Values in the Area
Average Home Value in this Area
Purchase History
| Date | Buyer | Sale Price | Title Company |
|---|---|---|---|
| Perdiago Zelia | $380,000 | -- | |
| Casanova Avelino | $300,000 | -- |
Source: Public Records
Mortgage History
| Date | Status | Borrower | Loan Amount |
|---|---|---|---|
| Open | Perdiago Zelia | $304,000 | |
| Previous Owner | Casanova Avelino | $200,000 |
Source: Public Records
Tax History Compared to Growth
Tax History
| Year | Tax Paid | Tax Assessment Tax Assessment Total Assessment is a certain percentage of the fair market value that is determined by local assessors to be the total taxable value of land and additions on the property. | Land | Improvement |
|---|---|---|---|---|
| 2025 | $8,276 | $68,400 | $23,700 | $44,700 |
| 2024 | $8,097 | $68,400 | $23,700 | $44,700 |
| 2023 | $8,097 | $68,400 | $23,700 | $44,700 |
| 2022 | $7,896 | $68,400 | $23,700 | $44,700 |
| 2021 | $7,831 | $68,400 | $23,700 | $44,700 |
| 2020 | $7,595 | $68,400 | $23,700 | $44,700 |
| 2019 | $7,415 | $68,400 | $23,700 | $44,700 |
| 2018 | $7,274 | $68,400 | $23,700 | $44,700 |
| 2017 | $7,146 | $68,400 | $23,700 | $44,700 |
| 2016 | $7,091 | $68,400 | $23,700 | $44,700 |
| 2015 | $6,967 | $68,400 | $23,700 | $44,700 |
| 2014 | $6,817 | $68,400 | $23,700 | $44,700 |
Source: Public Records
Map
Nearby Homes
- 14 Bonnie Ln
- 4 Periwinkle Place
- 48 Cypress Dr
- 71 Overbrook Dr
- 41 Clover Ave
- 37 E Hegel Ave
- 11 Bernice St
- 868 Inman Ave
- 31 Jordan Rd
- 91 Amherst Ave
- 36 Amherst Ave
- 984 Feather Bed Ln
- 227 Hawthorne Dr
- 262 W Hegel Ave
- 170 Jeffery Rd
- 67 Brookside Terrace
- 52 Brookside Terrace
- 70 Lancaster Rd
- 47 Marlboro Ln
- 74 Westminster Rd