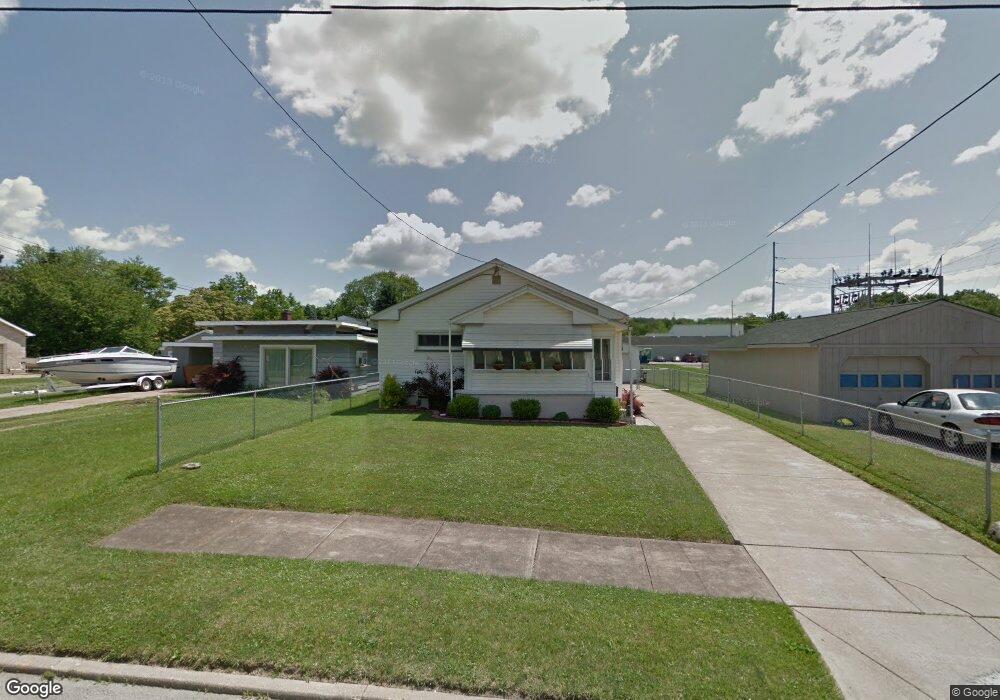
17 Earl St Girard, OH 44420
Estimated Value: $84,651 - $106,000
3
Beds
1
Bath
1,008
Sq Ft
$95/Sq Ft
Est. Value
About This Home
This home is located at 17 Earl St, Girard, OH 44420 and is currently estimated at $95,413, approximately $94 per square foot. 17 Earl St is a home located in Trumbull County with nearby schools including Prospect Elementary School, Girard Intermediate School, and Girard Junior High School.
Ownership History
Date
Name
Owned For
Owner Type
Purchase Details
Closed on
Mar 13, 2007
Sold by
Burrows Elsie M
Bought by
Baker Kenneth M and Baker Holly L
Current Estimated Value
Home Financials for this Owner
Home Financials are based on the most recent Mortgage that was taken out on this home.
Original Mortgage
$54,150
Outstanding Balance
$32,812
Interest Rate
6.28%
Mortgage Type
FHA
Estimated Equity
$62,601
Purchase Details
Closed on
Feb 26, 2007
Sold by
Burrows Elsie M
Bought by
Baker Kenneth M and Baker Holly L
Home Financials for this Owner
Home Financials are based on the most recent Mortgage that was taken out on this home.
Original Mortgage
$54,150
Outstanding Balance
$32,812
Interest Rate
6.28%
Mortgage Type
FHA
Estimated Equity
$62,601
Purchase Details
Closed on
Nov 12, 2003
Sold by
Burrows Elsie M
Bought by
Burrows Elsie M
Purchase Details
Closed on
Jan 1, 1990
Bought by
Frank O Burrows
Create a Home Valuation Report for This Property
The Home Valuation Report is an in-depth analysis detailing your home's value as well as a comparison with similar homes in the area
Home Values in the Area
Average Home Value in this Area
Purchase History
| Date | Buyer | Sale Price | Title Company |
|---|---|---|---|
| Baker Kenneth M | $55,000 | None Available | |
| Baker Kenneth M | $55,000 | None Available | |
| Burrows Elsie M | -- | -- | |
| Frank O Burrows | -- | -- |
Source: Public Records
Mortgage History
| Date | Status | Borrower | Loan Amount |
|---|---|---|---|
| Open | Burrows Elsie M | $54,150 | |
| Closed | Baker Kenneth M | $54,150 |
Source: Public Records
Tax History Compared to Growth
Tax History
| Year | Tax Paid | Tax Assessment Tax Assessment Total Assessment is a certain percentage of the fair market value that is determined by local assessors to be the total taxable value of land and additions on the property. | Land | Improvement |
|---|---|---|---|---|
| 2024 | $864 | $20,270 | $1,260 | $19,010 |
| 2023 | $864 | $20,270 | $1,260 | $19,010 |
| 2022 | $653 | $12,150 | $1,260 | $10,890 |
| 2021 | $655 | $12,150 | $1,260 | $10,890 |
| 2020 | $664 | $12,150 | $1,260 | $10,890 |
| 2019 | $665 | $11,520 | $1,260 | $10,260 |
| 2018 | $697 | $11,520 | $1,260 | $10,260 |
| 2017 | $695 | $11,520 | $1,260 | $10,260 |
| 2016 | $792 | $12,640 | $1,540 | $11,100 |
| 2015 | $783 | $12,640 | $1,540 | $11,100 |
| 2014 | $783 | $12,640 | $1,540 | $11,100 |
| 2013 | $828 | $13,620 | $1,540 | $12,080 |
Source: Public Records
Map
Nearby Homes
- 14 N Lorain Ave
- 322 Ohio Ave
- 294 Louis Ave
- 432 Taylor Ave
- 414 Parkview Dr
- 142 E Howard St
- 50 Abbey St
- 1050 Park Cir
- 106 E Liberty St
- 200 E Main St
- 0 W Wilson Ave
- 238 E Main St
- 216 E Main St
- 0 S State St Unit 5124606
- 403 N Saint Clair St
- 403 W Liberty St
- 349 Forsythe Ave
- 445 Powers Ave
- 52 Hartzell Ave
- 62 Ella St