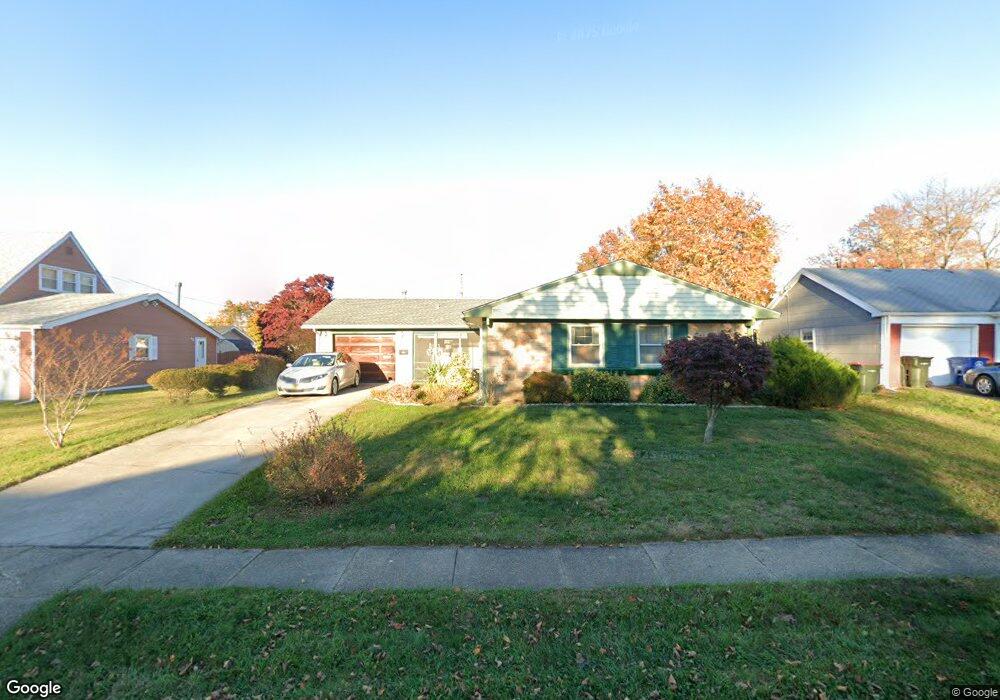
17 Edgemont Ln Willingboro, NJ 08046
Estimated Value: $341,017 - $371,000
--
Bed
--
Bath
1,776
Sq Ft
$202/Sq Ft
Est. Value
About This Home
This home is located at 17 Edgemont Ln, Willingboro, NJ 08046 and is currently estimated at $358,254, approximately $201 per square foot. 17 Edgemont Ln is a home located in Burlington County with nearby schools including Hawthorne Park Elementary School, Memorial Middle School, and Levitt Intermediate School.
Ownership History
Date
Name
Owned For
Owner Type
Purchase Details
Closed on
Sep 25, 2002
Sold by
Tiger Relocation Co
Bought by
Thompson Mae
Current Estimated Value
Home Financials for this Owner
Home Financials are based on the most recent Mortgage that was taken out on this home.
Original Mortgage
$88,000
Interest Rate
6.16%
Purchase Details
Closed on
Sep 30, 1998
Sold by
Home Loan & Investment Bank Fsb
Bought by
Cooper Michael J and Cooper Jesse M
Home Financials for this Owner
Home Financials are based on the most recent Mortgage that was taken out on this home.
Original Mortgage
$80,750
Interest Rate
6.99%
Mortgage Type
Seller Take Back
Purchase Details
Closed on
Feb 13, 1998
Sold by
Blaine Percy and Blaine Ida
Bought by
Home Loan & Investment Bank Fsb
Create a Home Valuation Report for This Property
The Home Valuation Report is an in-depth analysis detailing your home's value as well as a comparison with similar homes in the area
Home Values in the Area
Average Home Value in this Area
Purchase History
| Date | Buyer | Sale Price | Title Company |
|---|---|---|---|
| Thompson Mae | $110,000 | Executive Title & Abstract I | |
| Cooper Michael J | $85,000 | -- | |
| Home Loan & Investment Bank Fsb | -- | -- |
Source: Public Records
Mortgage History
| Date | Status | Borrower | Loan Amount |
|---|---|---|---|
| Previous Owner | Thompson Mae | $88,000 | |
| Previous Owner | Cooper Michael J | $80,750 |
Source: Public Records
Tax History Compared to Growth
Tax History
| Year | Tax Paid | Tax Assessment Tax Assessment Total Assessment is a certain percentage of the fair market value that is determined by local assessors to be the total taxable value of land and additions on the property. | Land | Improvement |
|---|---|---|---|---|
| 2025 | $6,894 | $159,700 | $43,100 | $116,600 |
| 2024 | $6,843 | $159,700 | $43,100 | $116,600 |
| 2023 | $6,843 | $159,700 | $43,100 | $116,600 |
| 2022 | $6,370 | $159,700 | $43,100 | $116,600 |
| 2021 | $6,382 | $159,700 | $43,100 | $116,600 |
| 2020 | $6,409 | $159,700 | $43,100 | $116,600 |
| 2019 | $6,348 | $159,700 | $43,100 | $116,600 |
| 2018 | $6,230 | $159,700 | $43,100 | $116,600 |
| 2017 | $6,056 | $159,700 | $43,100 | $116,600 |
| 2016 | $5,995 | $159,700 | $43,100 | $116,600 |
| 2015 | $5,789 | $159,700 | $43,100 | $116,600 |
| 2014 | $5,511 | $159,700 | $43,100 | $116,600 |
Source: Public Records
Map
Nearby Homes