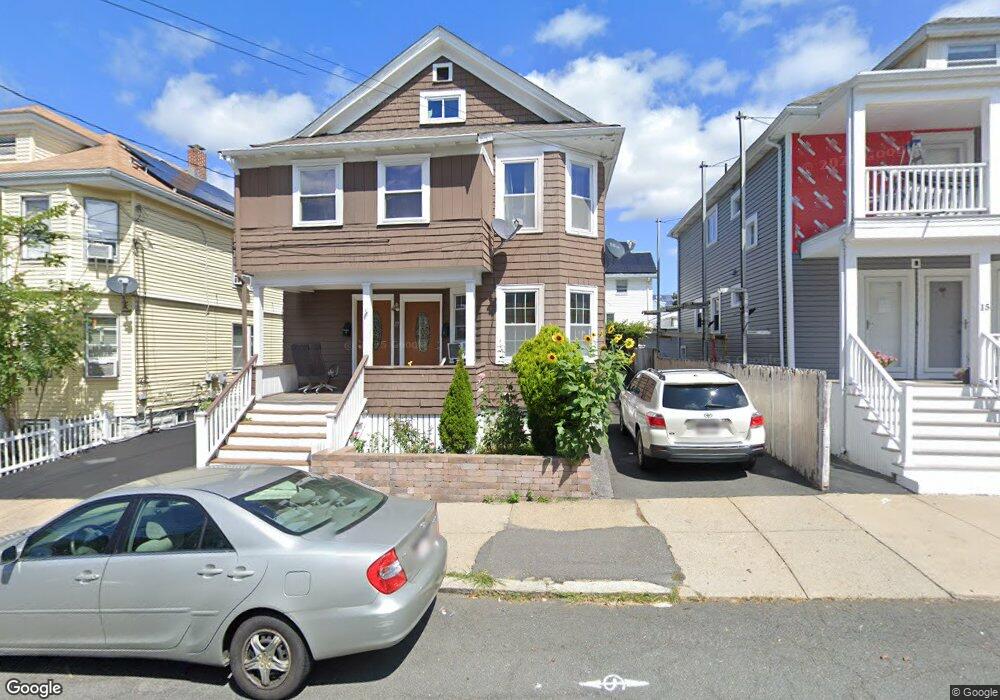
17 Edith St Everett, MA 02149
Glendale NeighborhoodEstimated Value: $698,655 - $847,000
5
Beds
2
Baths
1,748
Sq Ft
$449/Sq Ft
Est. Value
About This Home
This home is located at 17 Edith St, Everett, MA 02149 and is currently estimated at $785,664, approximately $449 per square foot. 17 Edith St is a home located in Middlesex County with nearby schools including Everett High School and Pioneer Charter School of Science.
Ownership History
Date
Name
Owned For
Owner Type
Purchase Details
Closed on
Sep 9, 2008
Sold by
Lemus Jose
Bought by
Pineda Francisca A and Pineda Jose A
Current Estimated Value
Home Financials for this Owner
Home Financials are based on the most recent Mortgage that was taken out on this home.
Original Mortgage
$312,530
Outstanding Balance
$209,559
Interest Rate
6.69%
Mortgage Type
Purchase Money Mortgage
Estimated Equity
$576,105
Purchase Details
Closed on
Nov 3, 2005
Sold by
Garcia-Sanchez Marlene M
Bought by
Lemus Jose M
Home Financials for this Owner
Home Financials are based on the most recent Mortgage that was taken out on this home.
Original Mortgage
$380,000
Interest Rate
5.85%
Mortgage Type
Purchase Money Mortgage
Purchase Details
Closed on
Jul 21, 2004
Sold by
Citiwide Dev & Constr
Bought by
Garcia-Sanchez Marlene M
Home Financials for this Owner
Home Financials are based on the most recent Mortgage that was taken out on this home.
Original Mortgage
$346,400
Interest Rate
6.28%
Mortgage Type
Purchase Money Mortgage
Purchase Details
Closed on
Jan 12, 2004
Sold by
Noftle Rt
Bought by
Citiwide Dev & Constr
Create a Home Valuation Report for This Property
The Home Valuation Report is an in-depth analysis detailing your home's value as well as a comparison with similar homes in the area
Home Values in the Area
Average Home Value in this Area
Purchase History
| Date | Buyer | Sale Price | Title Company |
|---|---|---|---|
| Pineda Francisca A | $315,000 | -- | |
| Pineda Francisca A | $315,000 | -- | |
| Lemus Jose M | $475,000 | -- | |
| Garcia-Sanchez Marlene M | $433,000 | -- | |
| Citiwide Dev & Constr | $290,000 | -- |
Source: Public Records
Mortgage History
| Date | Status | Borrower | Loan Amount |
|---|---|---|---|
| Open | Pineda Francisca A | $312,530 | |
| Closed | Pineda Francisca A | $312,530 | |
| Previous Owner | Lemus Jose M | $380,000 | |
| Previous Owner | Garcia-Sanchez Marlene M | $346,400 |
Source: Public Records
Tax History
| Year | Tax Paid | Tax Assessment Tax Assessment Total Assessment is a certain percentage of the fair market value that is determined by local assessors to be the total taxable value of land and additions on the property. | Land | Improvement |
|---|---|---|---|---|
| 2025 | $7,508 | $659,200 | $236,800 | $422,400 |
| 2024 | $6,839 | $596,800 | $207,400 | $389,400 |
| 2023 | $6,679 | $567,000 | $198,400 | $368,600 |
| 2022 | $5,499 | $530,800 | $189,400 | $341,400 |
| 2021 | $4,918 | $498,300 | $169,600 | $328,700 |
| 2020 | $5,183 | $487,100 | $169,600 | $317,500 |
| 2019 | $5,481 | $442,700 | $161,400 | $281,300 |
| 2018 | $5,376 | $390,100 | $140,700 | $249,400 |
| 2017 | $5,100 | $353,200 | $126,300 | $226,900 |
| 2016 | $4,569 | $316,200 | $112,700 | $203,500 |
| 2015 | $4,273 | $292,500 | $101,700 | $190,800 |
Source: Public Records
Map
Nearby Homes
- 859 Broadway Unit 15
- 881 Broadway Unit 44
- 13 Coolidge St
- 132 Vernal St
- 53 Sycamore St
- 5 Mason St
- 21 Hillside Ave Unit 21
- 19 Mills St
- 44 Walnut St
- 21 Central Ave Unit 10
- 21 Staples Ave Unit 26
- 15 Staples Ave Unit 45
- 15 Staples Ave Unit 31
- 51 Adams Ave
- 20 Fairmount St
- 272-274 Cross St Unit 4
- 272-274 Cross St Unit 3
- 112 Hadley St
- 211 Elm St
- 210 Hancock St
Your Personal Tour Guide
Ask me questions while you tour the home.