
Seller's Agent in 2025
Wendy Carpenito
Berkshire Hathaway HomeServices Commonwealth Real Estate
(781) 789-4840
28 in this area
132 Total Sales
Estimated Value: $641,000 - $680,177
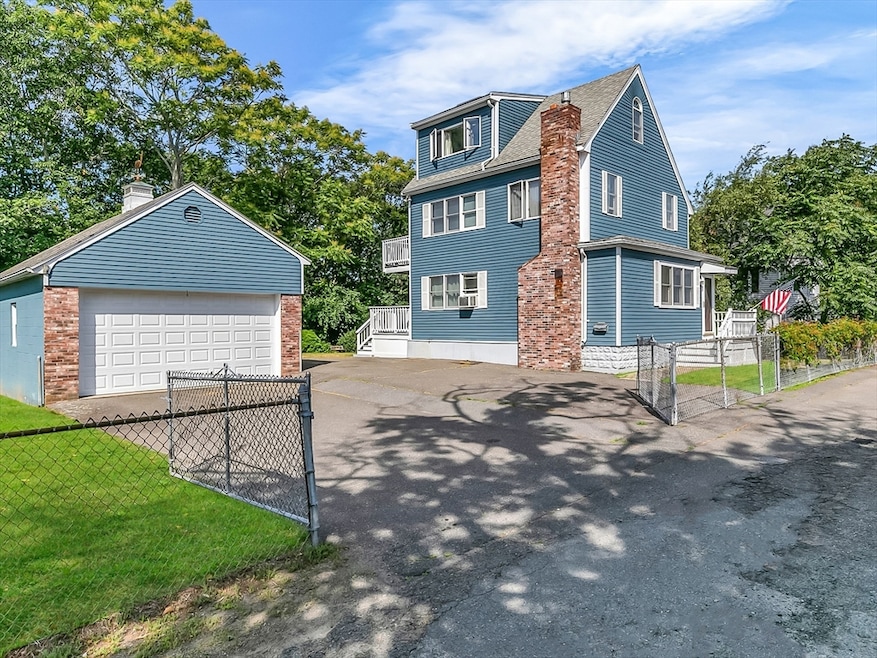
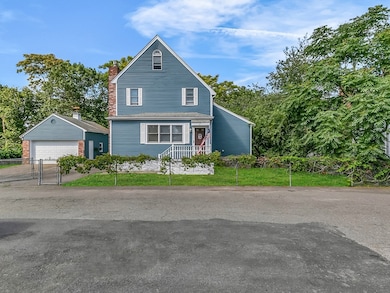
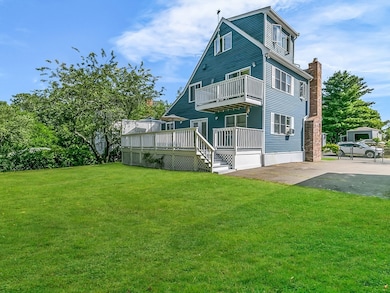
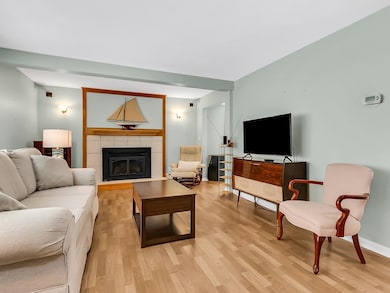
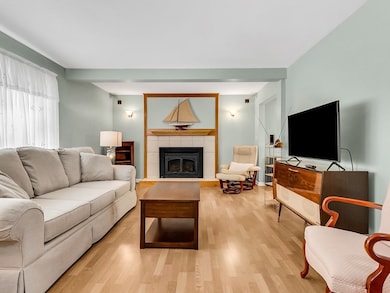
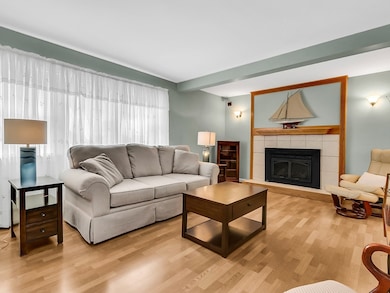
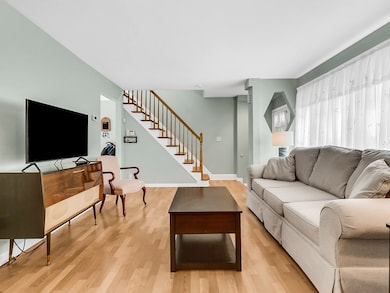
****BOM due to the unfortunate situation of Buyer losing his employment**** BEST VALUE IN SAUGUS!! PERFECTLY maintained and cared for 6 room Colonial boasting 2-3 bedrooms (1 has no closet), 1 1/2 baths with pedestal sinks, living room with cozy gas fireplace and laminate flooring, open to formal dining room, bright and sunny kitchen with skylight, spacious dining area and atrium door to large deck, convenient 1st floor laundry, second floor houses main bedroom featuring crown molding, slider to private balcony and mini-split a/c for summer enjoyment, 2nd bedroom or home office leading to unique 3rd level with amazing views, can be utilized as 3rd bedroom (no closet) or great family room - many possibilities! Two car detached garage with great loft storage and attached storage shed, level lot, conveniently located just outside of Cliftondale Square. Great Home - Great Opportunity! "Welcome home to Elaine Avenue"
Last Agent to Sell the Property
Berkshire Hathaway HomeServices Commonwealth Real Estate Listed on: 09/08/2025
| Date | Buyer | Sale Price | Title Company |
|---|---|---|---|
| Barrera Francisca | $650,000 | -- | |
| Collazzo Andrew | $182,000 | -- | |
| Dichicco Stephen | $135,000 | -- |
| Date | Status | Borrower | Loan Amount |
|---|---|---|---|
| Open | Barrera Francisca | $520,000 | |
| Previous Owner | Dichicco Stephen | $139,482 | |
| Previous Owner | Dichicco Stephen | $145,600 | |
| Previous Owner | Dichicco Stephen | $175,000 | |
| Previous Owner | Dichicco Stephen | $170,000 |
| Date | Event | Price | List to Sale | Price per Sq Ft |
|---|---|---|---|---|
| 12/17/2025 12/17/25 | Sold | $650,000 | -3.7% | $372 / Sq Ft |
| 11/12/2025 11/12/25 | Pending | -- | -- | -- |
| 10/13/2025 10/13/25 | Price Changed | $675,000 | 0.0% | $386 / Sq Ft |
| 10/13/2025 10/13/25 | For Sale | $675,000 | -3.6% | $386 / Sq Ft |
| 10/07/2025 10/07/25 | Pending | -- | -- | -- |
| 09/08/2025 09/08/25 | For Sale | $699,900 | -- | $401 / Sq Ft |
| Year | Tax Paid | Tax Assessment Tax Assessment Total Assessment is a certain percentage of the fair market value that is determined by local assessors to be the total taxable value of land and additions on the property. | Land | Improvement |
|---|---|---|---|---|
| 2025 | $6,616 | $619,500 | $308,300 | $311,200 |
| 2024 | $6,346 | $595,900 | $290,700 | $305,200 |
| 2023 | $6,116 | $543,200 | $255,500 | $287,700 |
| 2022 | $5,748 | $478,600 | $234,300 | $244,300 |
| 2021 | $5,526 | $447,800 | $203,500 | $244,300 |
| 2020 | $5,116 | $429,200 | $193,800 | $235,400 |
| 2019 | $4,881 | $400,700 | $176,200 | $224,500 |
| 2018 | $4,543 | $392,300 | $170,900 | $221,400 |
| 2017 | $4,416 | $366,500 | $159,400 | $207,100 |
| 2016 | $3,658 | $299,800 | $159,200 | $140,600 |
| 2015 | $3,433 | $285,600 | $151,600 | $134,000 |
| 2014 | $3,547 | $305,500 | $166,800 | $138,700 |
Seller's Agent in 2025
Wendy Carpenito
Berkshire Hathaway HomeServices Commonwealth Real Estate
(781) 789-4840
28 in this area
132 Total Sales
Buyer's Agent in 2025
Saul Perlera
Perlera Real Estate
(617) 775-0609
3 in this area
66 Total Sales
Source: MLS Property Information Network (MLS PIN)
MLS Number: 73427446
APN: SAUG-000006G-000013-000007
Disclaimer: Certain information contained herein is derived from information provided by parties other than Homes.com. All information provided is deemed reliable, but is not guaranteed to be accurate and should be independently verified.
![]() The property listing data and information, or the Images, set forth herein were provided to MLS Property Information Network, Inc. from third party sources, including sellers, lessors and public records, and were compiled by MLS Property Information Network, Inc. The property listing data and information, and the Images, are for the personal, non-commercial use of consumers having a good faith interest in purchasing or leasing listed properties of the type displayed to them and may not be used for any purpose other than to identify prospective properties which such consumers may have a good faith interest in purchasing or leasing. MLS Property Information Network, Inc. and its subscribers disclaim any and all representations and warranties as to the accuracy of the property listing data and information, or as to the accuracy of any of the Images, set forth herein.
The property listing data and information, or the Images, set forth herein were provided to MLS Property Information Network, Inc. from third party sources, including sellers, lessors and public records, and were compiled by MLS Property Information Network, Inc. The property listing data and information, and the Images, are for the personal, non-commercial use of consumers having a good faith interest in purchasing or leasing listed properties of the type displayed to them and may not be used for any purpose other than to identify prospective properties which such consumers may have a good faith interest in purchasing or leasing. MLS Property Information Network, Inc. and its subscribers disclaim any and all representations and warranties as to the accuracy of the property listing data and information, or as to the accuracy of any of the Images, set forth herein.
Ask me questions while you tour the home.