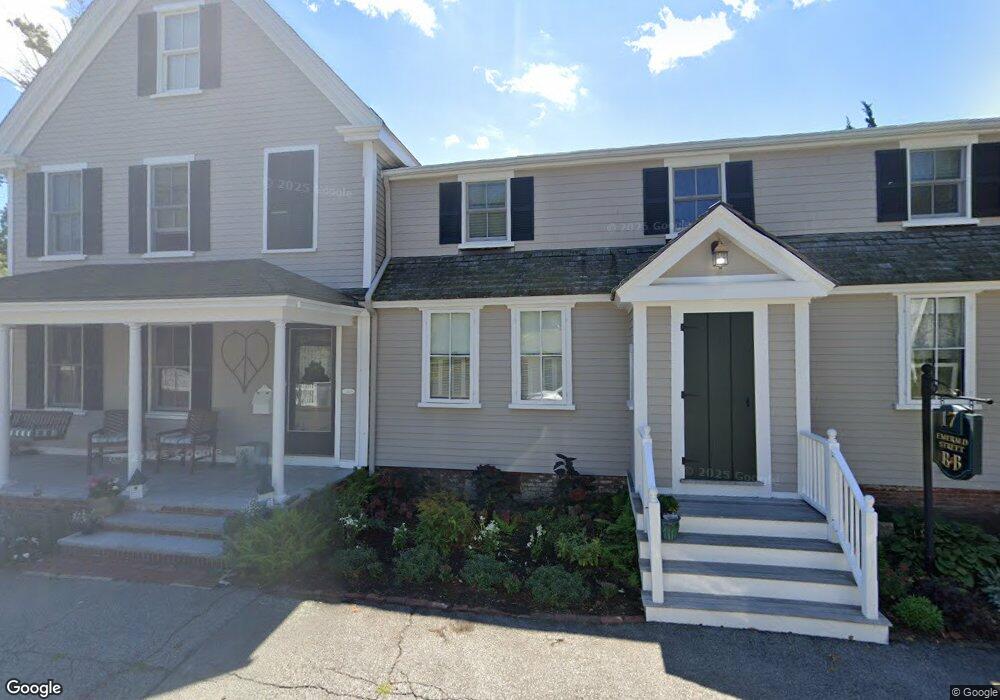
17 Emerald St Hingham, MA 02043
Estimated Value: $1,332,819 - $1,730,000
5
Beds
3
Baths
2,855
Sq Ft
$542/Sq Ft
Est. Value
About This Home
This home is located at 17 Emerald St, Hingham, MA 02043 and is currently estimated at $1,548,705, approximately $542 per square foot. 17 Emerald St is a home located in Plymouth County with nearby schools including William L. Foster Elementary School, Hingham Middle School, and Hingham High School.
Ownership History
Date
Name
Owned For
Owner Type
Purchase Details
Closed on
Mar 22, 2023
Sold by
Mcnulty Terrence M and Mcnulty Janet K
Bought by
Klaehn Mcnulty Ft
Current Estimated Value
Purchase Details
Closed on
Aug 4, 1992
Sold by
Source One Mtg Svc
Bought by
Pike Gregory J
Purchase Details
Closed on
May 21, 1992
Sold by
Coggins Sherwood
Bought by
Source One Mtg Ser
Purchase Details
Closed on
Jun 19, 1984
Bought by
Mcnulty Terrence M and Mcnulty Janet K
Create a Home Valuation Report for This Property
The Home Valuation Report is an in-depth analysis detailing your home's value as well as a comparison with similar homes in the area
Purchase History
| Date | Buyer | Sale Price | Title Company |
|---|---|---|---|
| Klaehn Mcnulty Ft | -- | None Available | |
| Pike Gregory J | $81,000 | -- | |
| Source One Mtg Ser | $70,000 | -- | |
| Mcnulty Terrence M | $75,000 | -- |
Source: Public Records
Mortgage History
| Date | Status | Borrower | Loan Amount |
|---|---|---|---|
| Previous Owner | Mcnulty Terrence M | $55,000 | |
| Previous Owner | Mcnulty Terrence M | $325,000 |
Source: Public Records
Tax History
| Year | Tax Paid | Tax Assessment Tax Assessment Total Assessment is a certain percentage of the fair market value that is determined by local assessors to be the total taxable value of land and additions on the property. | Land | Improvement |
|---|---|---|---|---|
| 2025 | $12,475 | $1,167,000 | $535,500 | $631,500 |
| 2024 | $12,517 | $1,153,600 | $535,500 | $618,100 |
| 2023 | $11,348 | $1,134,800 | $535,500 | $599,300 |
| 2022 | $10,953 | $947,500 | $445,000 | $502,500 |
| 2021 | $10,959 | $928,700 | $445,000 | $483,700 |
| 2020 | $10,708 | $928,700 | $445,000 | $483,700 |
| 2019 | $10,872 | $920,600 | $445,000 | $475,600 |
| 2018 | $10,369 | $881,000 | $445,000 | $436,000 |
| 2017 | $9,143 | $746,400 | $444,400 | $302,000 |
| 2016 | $9,058 | $725,200 | $423,200 | $302,000 |
| 2015 | $8,374 | $668,300 | $402,800 | $265,500 |
Source: Public Records
Map
Nearby Homes
Your Personal Tour Guide
Ask me questions while you tour the home.