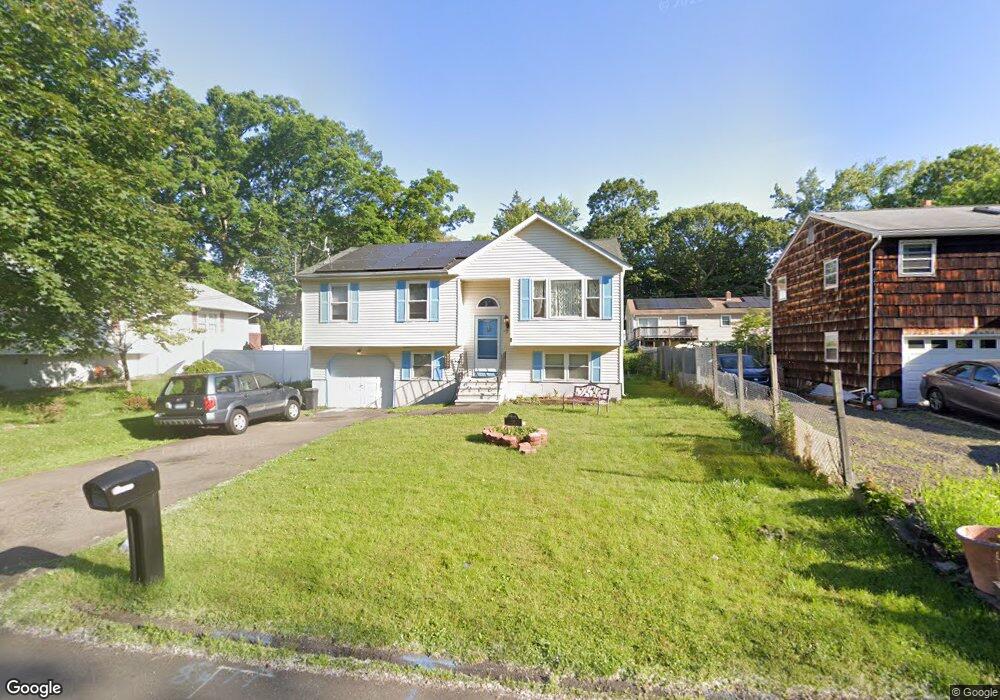
17 Emma St West Haven, CT 06516
Allingtown NeighborhoodEstimated Value: $299,000 - $380,000
3
Beds
2
Baths
1,108
Sq Ft
$307/Sq Ft
Est. Value
About This Home
This home is located at 17 Emma St, West Haven, CT 06516 and is currently estimated at $339,913, approximately $306 per square foot. 17 Emma St is a home located in New Haven County with nearby schools including Carrigan 5/6 Intermediate School, Harry M. Bailey Middle School, and West Haven High School.
Ownership History
Date
Name
Owned For
Owner Type
Purchase Details
Closed on
Apr 5, 1995
Sold by
Concept Home Dev Inc
Bought by
Dixon Paul and Dixon Janet
Current Estimated Value
Home Financials for this Owner
Home Financials are based on the most recent Mortgage that was taken out on this home.
Original Mortgage
$103,550
Interest Rate
8.66%
Mortgage Type
Purchase Money Mortgage
Create a Home Valuation Report for This Property
The Home Valuation Report is an in-depth analysis detailing your home's value as well as a comparison with similar homes in the area
Home Values in the Area
Average Home Value in this Area
Purchase History
| Date | Buyer | Sale Price | Title Company |
|---|---|---|---|
| Dixon Paul | $109,000 | -- | |
| Dixon Paul | $109,000 | -- |
Source: Public Records
Mortgage History
| Date | Status | Borrower | Loan Amount |
|---|---|---|---|
| Open | Dixon Paul | $139,080 | |
| Closed | Dixon Paul | $137,025 | |
| Closed | Dixon Paul | $103,550 |
Source: Public Records
Tax History Compared to Growth
Tax History
| Year | Tax Paid | Tax Assessment Tax Assessment Total Assessment is a certain percentage of the fair market value that is determined by local assessors to be the total taxable value of land and additions on the property. | Land | Improvement |
|---|---|---|---|---|
| 2025 | $7,011 | $206,150 | $59,710 | $146,440 |
| 2024 | $5,970 | $124,670 | $41,370 | $83,300 |
| 2023 | $5,787 | $124,670 | $41,370 | $83,300 |
| 2022 | $5,686 | $124,670 | $41,370 | $83,300 |
| 2021 | $5,687 | $124,670 | $41,370 | $83,300 |
| 2020 | $5,606 | $108,850 | $33,320 | $75,530 |
| 2019 | $5,519 | $108,850 | $33,320 | $75,530 |
| 2018 | $5,368 | $108,850 | $33,320 | $75,530 |
| 2017 | $5,201 | $108,850 | $33,320 | $75,530 |
| 2016 | $5,043 | $108,850 | $33,320 | $75,530 |
| 2015 | $4,879 | $119,910 | $37,100 | $82,810 |
| 2014 | $4,782 | $119,910 | $37,100 | $82,810 |
Source: Public Records
Map
Nearby Homes
- 81 Homeside Ave
- 35 Terrace Ave
- 194 Homeside Ave
- 104 Terrace Ave
- 63 Glade St Unit C1
- 60 Andrews St
- 38 Chauncey St
- 1014 Campbell Ave Unit 14
- 14 Homestead Ave
- 161 W Spring St Unit B2
- 161 W Spring St Unit C1
- 941 Campbell Ave
- 89 Coleman St Unit 213
- 78 Nonquit St
- 227 W Spring St
- 0 Burwell & Woodfield Rd Unit 24051262
- 29 Abner St
- 0 Burwell Rd
- 107 Tuthill St
- 39 Medford St