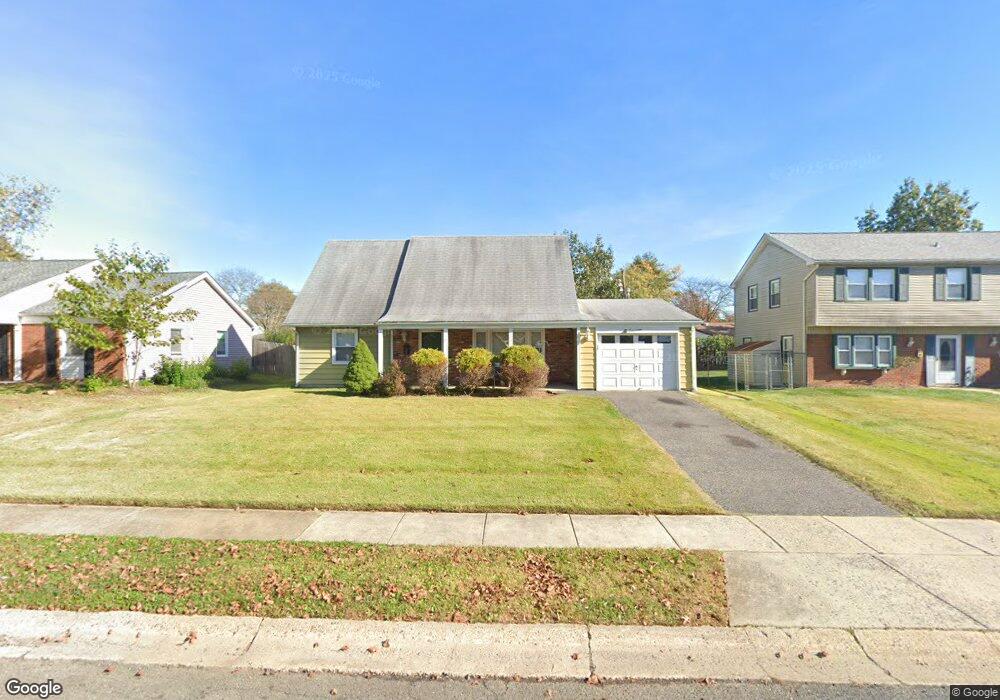
17 Exton Ln Willingboro, NJ 08046
Estimated Value: $248,047 - $372,000
--
Bed
--
Bath
1,573
Sq Ft
$214/Sq Ft
Est. Value
About This Home
This home is located at 17 Exton Ln, Willingboro, NJ 08046 and is currently estimated at $337,262, approximately $214 per square foot. 17 Exton Ln is a home located in Burlington County with nearby schools including Twin Hills Elementary School, Memorial Middle School, and Levitt Intermediate School.
Ownership History
Date
Name
Owned For
Owner Type
Purchase Details
Closed on
Sep 13, 1999
Sold by
Armstrong Michael A and Armstrong Karen T
Bought by
Drake Michael
Current Estimated Value
Home Financials for this Owner
Home Financials are based on the most recent Mortgage that was taken out on this home.
Original Mortgage
$79,141
Outstanding Balance
$23,427
Interest Rate
7.8%
Mortgage Type
FHA
Estimated Equity
$313,835
Create a Home Valuation Report for This Property
The Home Valuation Report is an in-depth analysis detailing your home's value as well as a comparison with similar homes in the area
Home Values in the Area
Average Home Value in this Area
Purchase History
| Date | Buyer | Sale Price | Title Company |
|---|---|---|---|
| Drake Michael | $88,000 | Collegiate Title & Abstract |
Source: Public Records
Mortgage History
| Date | Status | Borrower | Loan Amount |
|---|---|---|---|
| Open | Drake Michael | $79,141 |
Source: Public Records
Tax History Compared to Growth
Tax History
| Year | Tax Paid | Tax Assessment Tax Assessment Total Assessment is a certain percentage of the fair market value that is determined by local assessors to be the total taxable value of land and additions on the property. | Land | Improvement |
|---|---|---|---|---|
| 2025 | $6,242 | $144,600 | $43,100 | $101,500 |
| 2024 | $6,196 | $144,600 | $43,100 | $101,500 |
| 2023 | $6,196 | $144,600 | $43,100 | $101,500 |
| 2022 | $5,768 | $144,600 | $43,100 | $101,500 |
| 2021 | $5,778 | $144,600 | $43,100 | $101,500 |
| 2020 | $5,803 | $144,600 | $43,100 | $101,500 |
| 2019 | $5,748 | $144,600 | $43,100 | $101,500 |
| 2018 | $5,641 | $144,600 | $43,100 | $101,500 |
| 2017 | $5,483 | $144,600 | $43,100 | $101,500 |
| 2016 | $5,428 | $144,600 | $43,100 | $101,500 |
| 2015 | $5,242 | $144,600 | $43,100 | $101,500 |
| 2014 | $4,990 | $144,600 | $43,100 | $101,500 |
Source: Public Records
Map
Nearby Homes