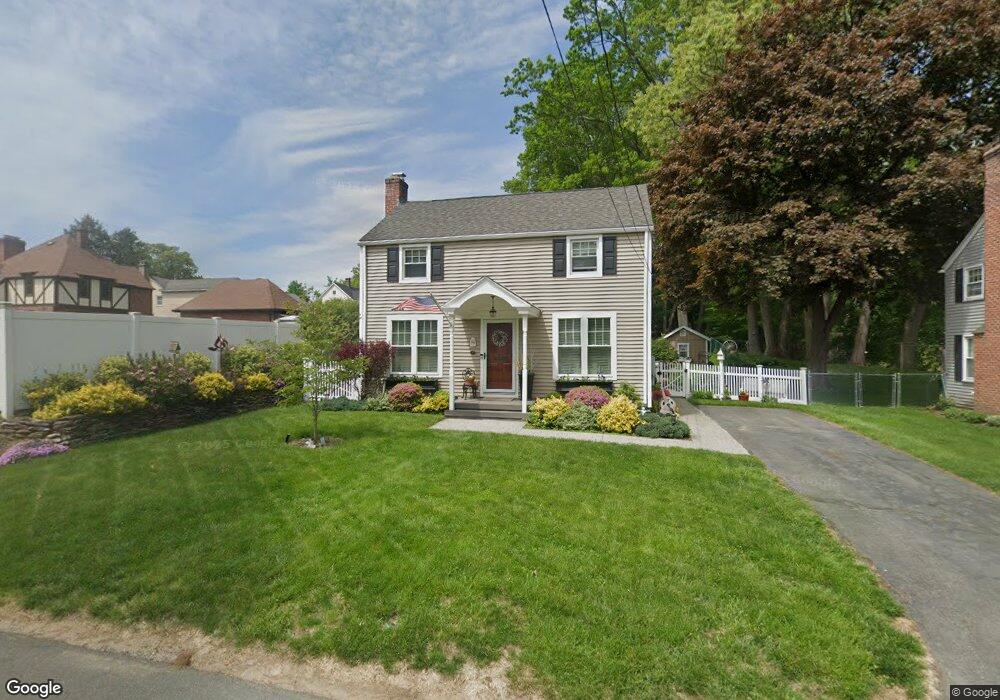
17 Fenor St West Springfield, MA 01089
Estimated Value: $288,004 - $333,000
3
Beds
2
Baths
1,080
Sq Ft
$290/Sq Ft
Est. Value
About This Home
This home is located at 17 Fenor St, West Springfield, MA 01089 and is currently estimated at $313,501, approximately $290 per square foot. 17 Fenor St is a home located in Hampden County with nearby schools including West Springfield High School and St Thomas The Apostle School.
Ownership History
Date
Name
Owned For
Owner Type
Purchase Details
Closed on
Jun 10, 1999
Sold by
Mark Oliver Custom Hms
Bought by
Picard Nelson P and Picard Paula A
Current Estimated Value
Home Financials for this Owner
Home Financials are based on the most recent Mortgage that was taken out on this home.
Original Mortgage
$94,000
Outstanding Balance
$24,485
Interest Rate
6.9%
Mortgage Type
Purchase Money Mortgage
Estimated Equity
$289,016
Purchase Details
Closed on
Dec 16, 1998
Sold by
Department Of Housing & Urban Dev
Bought by
Mark A Oliver Custom
Purchase Details
Closed on
Jun 3, 1998
Sold by
Flaherty Jan L and Flaherty James F
Bought by
Department Of Housing & Urban Dev
Purchase Details
Closed on
Nov 29, 1996
Sold by
Theobald Douglas A and Theobald Cory
Bought by
Flaherty James F and Flaherty Jan L
Purchase Details
Closed on
Dec 30, 1991
Sold by
Greguoli John R and Greguoli Lynn
Bought by
Theobald Douglas A and Theobald Cory
Purchase Details
Closed on
Feb 23, 1987
Sold by
Est Ruth E Mellor
Bought by
Greguoli John R
Create a Home Valuation Report for This Property
The Home Valuation Report is an in-depth analysis detailing your home's value as well as a comparison with similar homes in the area
Home Values in the Area
Average Home Value in this Area
Purchase History
| Date | Buyer | Sale Price | Title Company |
|---|---|---|---|
| Picard Nelson P | $117,500 | -- | |
| Mark A Oliver Custom | $78,000 | -- | |
| Department Of Housing & Urban Dev | $121,459 | -- | |
| Flaherty James F | $109,000 | -- | |
| Theobald Douglas A | $106,500 | -- | |
| Greguoli John R | $97,500 | -- |
Source: Public Records
Mortgage History
| Date | Status | Borrower | Loan Amount |
|---|---|---|---|
| Open | Greguoli John R | $15,300 | |
| Open | Greguoli John R | $94,000 |
Source: Public Records
Tax History
| Year | Tax Paid | Tax Assessment Tax Assessment Total Assessment is a certain percentage of the fair market value that is determined by local assessors to be the total taxable value of land and additions on the property. | Land | Improvement |
|---|---|---|---|---|
| 2025 | $3,167 | $213,000 | $83,800 | $129,200 |
| 2024 | $3,009 | $203,200 | $83,800 | $119,400 |
| 2023 | $2,791 | $179,600 | $81,900 | $97,700 |
| 2022 | $2,550 | $161,800 | $74,300 | $87,500 |
| 2021 | $2,457 | $145,400 | $68,300 | $77,100 |
| 2020 | $2,477 | $145,800 | $68,300 | $77,500 |
| 2019 | $2,473 | $145,800 | $68,300 | $77,500 |
| 2018 | $2,472 | $145,000 | $68,300 | $76,700 |
| 2017 | $2,472 | $145,000 | $68,300 | $76,700 |
| 2016 | $2,419 | $142,400 | $64,200 | $78,200 |
| 2015 | $2,372 | $139,600 | $62,900 | $76,700 |
| 2014 | $574 | $139,600 | $62,900 | $76,700 |
Source: Public Records
Map
Nearby Homes
Your Personal Tour Guide
Ask me questions while you tour the home.