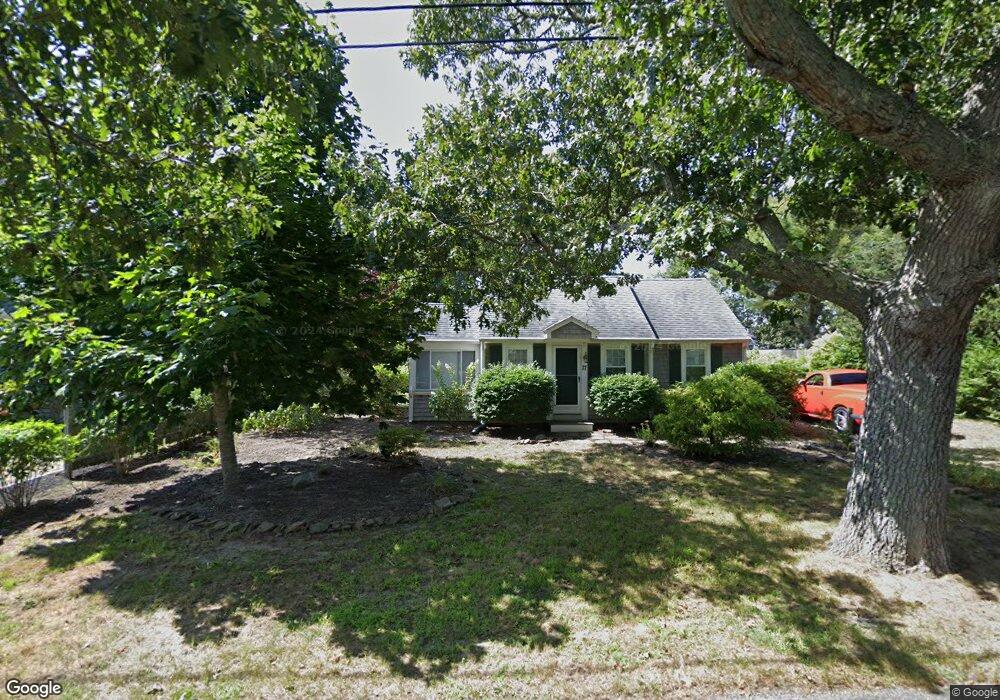
17 Fenway Rd Dennis Port, MA 02639
Dennis Port NeighborhoodEstimated Value: $608,000 - $748,000
2
Beds
2
Baths
1,048
Sq Ft
$649/Sq Ft
Est. Value
About This Home
This home is located at 17 Fenway Rd, Dennis Port, MA 02639 and is currently estimated at $679,826, approximately $648 per square foot. 17 Fenway Rd is a home located in Barnstable County with nearby schools including Dennis-Yarmouth Regional High School and St. Pius X. School.
Ownership History
Date
Name
Owned For
Owner Type
Purchase Details
Closed on
Nov 2, 2009
Sold by
Cavanaugh Carol A
Bought by
Cavanaugh Carol A and Smith Melissa
Current Estimated Value
Purchase Details
Closed on
Sep 13, 1984
Bought by
Cavanaugh Carol A and Smith Melissa
Create a Home Valuation Report for This Property
The Home Valuation Report is an in-depth analysis detailing your home's value as well as a comparison with similar homes in the area
Home Values in the Area
Average Home Value in this Area
Purchase History
| Date | Buyer | Sale Price | Title Company |
|---|---|---|---|
| Cavanaugh Carol A | -- | -- | |
| Cavanaugh Carol A | $70,000 | -- | |
| Cavanaugh Carol A | -- | -- |
Source: Public Records
Tax History Compared to Growth
Tax History
| Year | Tax Paid | Tax Assessment Tax Assessment Total Assessment is a certain percentage of the fair market value that is determined by local assessors to be the total taxable value of land and additions on the property. | Land | Improvement |
|---|---|---|---|---|
| 2025 | $2,833 | $654,200 | $291,400 | $362,800 |
| 2024 | $2,728 | $621,500 | $280,200 | $341,300 |
| 2023 | $2,639 | $565,100 | $254,700 | $310,400 |
| 2022 | $2,433 | $434,500 | $200,800 | $233,700 |
| 2021 | $2,352 | $390,000 | $196,800 | $193,200 |
| 2020 | $2,283 | $374,200 | $196,800 | $177,400 |
| 2019 | $2,187 | $354,400 | $209,500 | $144,900 |
| 2018 | $2,111 | $333,000 | $199,500 | $133,500 |
| 2017 | $1,924 | $312,900 | $183,700 | $129,200 |
| 2016 | $1,853 | $283,800 | $173,200 | $110,600 |
| 2015 | $1,816 | $283,800 | $173,200 | $110,600 |
| 2014 | $1,718 | $270,600 | $162,700 | $107,900 |
Source: Public Records
Map
Nearby Homes
- 37-A Beach Hills Rd
- 22 Ferncliff Rd
- 37 Beach Hills Rd
- 102 Sea St
- 262 Old Wharf Rd Unit 67
- 262 Old Wharf Rd Unit 5
- 262 Old Wharf Rd Unit 5
- 262 Old Wharf Rd Unit 20
- 262 Old Wharf Rd Unit 87
- 402 Old Wharf Rd
- 402 Old Wharf Rd
- 405 Old Wharf Rd Unit B204
- 405 Old Wharf Rd Unit B204
- 241 Old Wharf Rd Unit 82
- 241 Old Wharf Rd Unit 127
- 241 Old Wharf Rd Unit 90
- 217 Old Wharf Rd Unit 64
- 9 Chase Ave Unit 6
- 11 Ocean Park W
- 31 Easy St