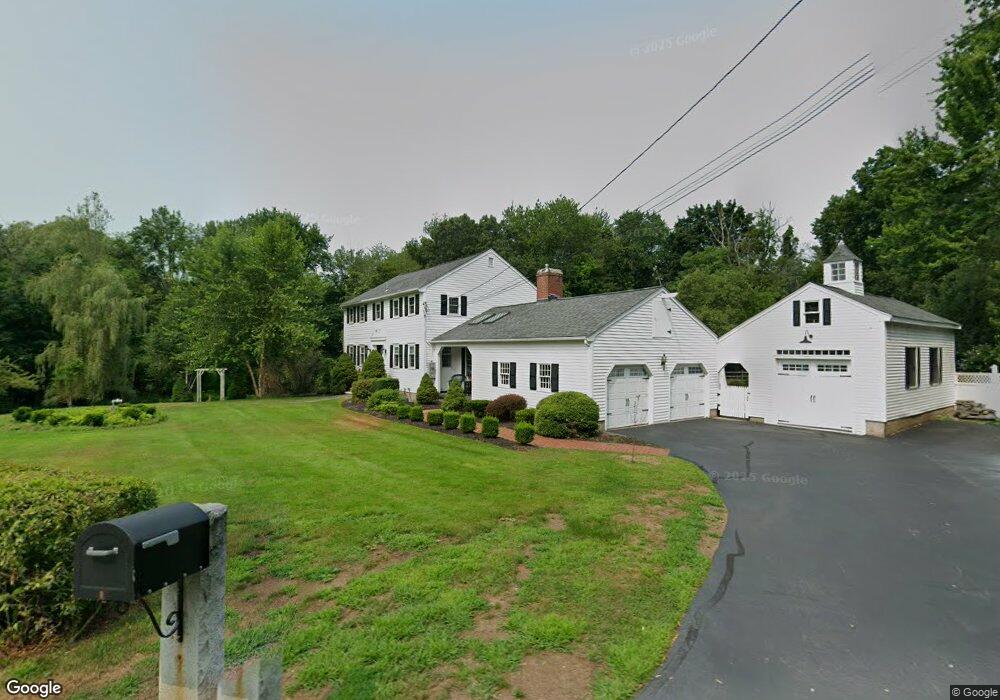
17 Flagg Rd Westford, MA 01886
Estimated Value: $763,000 - $861,000
3
Beds
3
Baths
2,167
Sq Ft
$376/Sq Ft
Est. Value
About This Home
This home is located at 17 Flagg Rd, Westford, MA 01886 and is currently estimated at $814,208, approximately $375 per square foot. 17 Flagg Rd is a home located in Middlesex County with nearby schools including John A. Crisafulli Elementary School, Col John Robinson, and Blanchard Middle School.
Ownership History
Date
Name
Owned For
Owner Type
Purchase Details
Closed on
May 26, 2021
Sold by
Bonenfant Edward E and Bonenfant Suzanne
Bought by
Bonenfant Ft
Current Estimated Value
Purchase Details
Closed on
Apr 3, 1972
Bought by
Bonenfant Edward E and Bonenfant Suzanne
Create a Home Valuation Report for This Property
The Home Valuation Report is an in-depth analysis detailing your home's value as well as a comparison with similar homes in the area
Home Values in the Area
Average Home Value in this Area
Purchase History
| Date | Buyer | Sale Price | Title Company |
|---|---|---|---|
| Bonenfant Ft | -- | None Available | |
| Bonenfant Edward E | $40,000 | -- |
Source: Public Records
Mortgage History
| Date | Status | Borrower | Loan Amount |
|---|---|---|---|
| Previous Owner | Bonenfant Edward E | $230,000 | |
| Previous Owner | Bonenfant Edward E | $75,000 | |
| Previous Owner | Bonenfant Edward E | $60,000 | |
| Previous Owner | Bonenfant Edward E | $50,000 |
Source: Public Records
Tax History
| Year | Tax Paid | Tax Assessment Tax Assessment Total Assessment is a certain percentage of the fair market value that is determined by local assessors to be the total taxable value of land and additions on the property. | Land | Improvement |
|---|---|---|---|---|
| 2025 | $9,892 | $734,400 | $346,500 | $387,900 |
| 2024 | $9,638 | $699,900 | $330,000 | $369,900 |
| 2023 | $9,938 | $673,300 | $314,100 | $359,200 |
| 2022 | $9,983 | $619,300 | $276,400 | $342,900 |
| 2021 | $9,541 | $573,400 | $276,400 | $297,000 |
| 2020 | $9,383 | $574,600 | $276,400 | $298,200 |
| 2019 | $5,616 | $552,800 | $276,400 | $276,400 |
| 2018 | $8,787 | $543,100 | $266,700 | $276,400 |
| 2017 | $8,536 | $520,200 | $266,700 | $253,500 |
| 2016 | $8,298 | $509,100 | $254,700 | $254,400 |
| 2015 | $7,966 | $490,500 | $235,100 | $255,400 |
| 2014 | $7,953 | $479,100 | $236,800 | $242,300 |
Source: Public Records
Map
Nearby Homes
- 6 Colonel Rolls Dr
- 12 Patten Rd
- 41 Flagg Rd
- 8 Bixby Ln
- 91 Jimney Dr Unit 91
- 62 Main St
- 66 Patten Rd
- 82 Pleasant St
- 11 River St
- 7 3rd St
- 4 Heywood Rd
- 20 Honeysuckle Rd
- 3 Hillside Ave
- 128 Main St Unit 1
- 9 Elm St
- Lot 1 & 3 Beaver Brook Rd
- 23 Apache Way Unit 23
- 34 West St
- 2 Lady Constance Way Unit 19
- 2 Wendell Place Unit 1
- 15 Flagg Rd
- 24 Flagg Rd
- 20 Flagg Rd
- 19 Flagg Rd
- 1 Alcorn Crossing
- 1 Alcorn Crossing
- 16 Flagg Rd
- 26 Flagg Rd
- 27 Flagg Rd
- 19R Flagg Rd
- 1 Noonan Way
- Lot BB Alcorn Crossing
- 13 Flagg Rd
- 1r Alcorn Crossing
- 6 Noonan Way
- Lot BB Alcorn Crossing (1)
- 29 Flagg Rd
- 6 Alcorn Crossing
- 3 Alcorn Crossing
- 4 Noonan Way
Your Personal Tour Guide
Ask me questions while you tour the home.