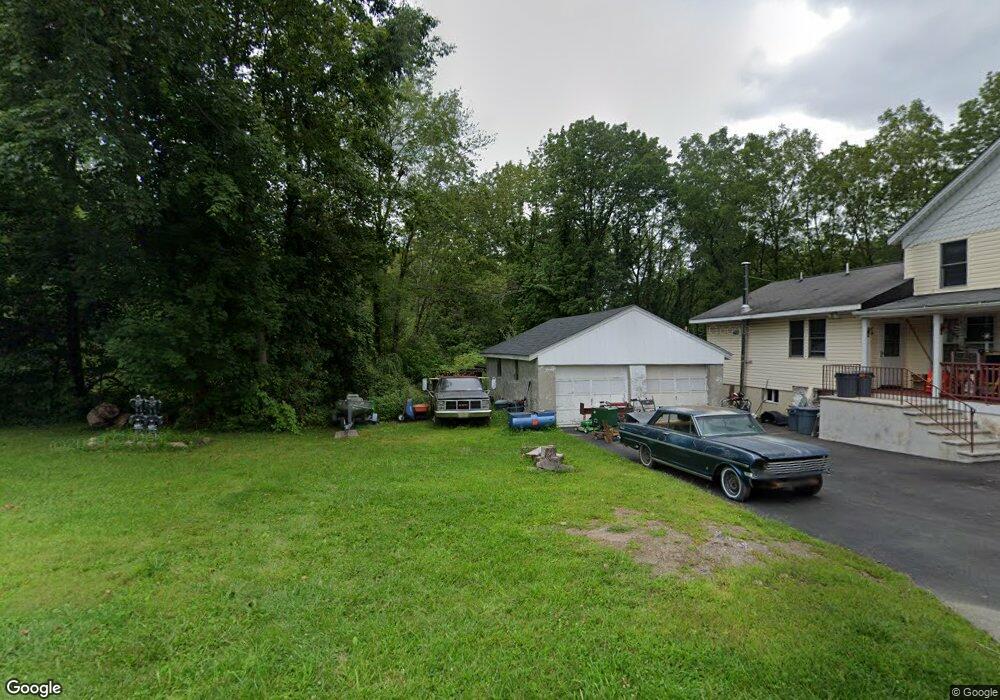
17 Flanders Rd Netcong, NJ 07857
Estimated Value: $495,000 - $511,000
--
Bed
--
Bath
1,876
Sq Ft
$267/Sq Ft
Est. Value
About This Home
This home is located at 17 Flanders Rd, Netcong, NJ 07857 and is currently estimated at $500,357, approximately $266 per square foot. 17 Flanders Rd is a home located in Morris County with nearby schools including Netcong Elementary School, Lenape Val Regional High School, and St. Therese School.
Ownership History
Date
Name
Owned For
Owner Type
Purchase Details
Closed on
Jan 15, 1998
Sold by
White Mary Lou Mcgillick and Mcgillick Joseph
Bought by
Marquardt Steven C and Marquardt Patricia
Current Estimated Value
Home Financials for this Owner
Home Financials are based on the most recent Mortgage that was taken out on this home.
Original Mortgage
$80,000
Outstanding Balance
$13,847
Interest Rate
7.11%
Estimated Equity
$486,510
Create a Home Valuation Report for This Property
The Home Valuation Report is an in-depth analysis detailing your home's value as well as a comparison with similar homes in the area
Home Values in the Area
Average Home Value in this Area
Purchase History
| Date | Buyer | Sale Price | Title Company |
|---|---|---|---|
| Marquardt Steven C | $85,000 | -- |
Source: Public Records
Mortgage History
| Date | Status | Borrower | Loan Amount |
|---|---|---|---|
| Open | Marquardt Steven C | $80,000 |
Source: Public Records
Tax History Compared to Growth
Tax History
| Year | Tax Paid | Tax Assessment Tax Assessment Total Assessment is a certain percentage of the fair market value that is determined by local assessors to be the total taxable value of land and additions on the property. | Land | Improvement |
|---|---|---|---|---|
| 2025 | $10,647 | $311,600 | $104,200 | $207,400 |
| 2024 | $10,741 | $311,600 | $104,200 | $207,400 |
| 2023 | $10,741 | $311,600 | $104,200 | $207,400 |
| 2022 | $9,731 | $311,600 | $104,200 | $207,400 |
| 2021 | $9,731 | $311,600 | $104,200 | $207,400 |
| 2020 | $6,983 | $227,000 | $130,800 | $96,200 |
| 2019 | $6,647 | $227,000 | $130,800 | $96,200 |
| 2018 | $6,249 | $227,000 | $130,800 | $96,200 |
| 2017 | $6,004 | $227,000 | $130,800 | $96,200 |
| 2016 | $6,690 | $260,000 | $145,300 | $114,700 |
| 2015 | $6,445 | $260,000 | $145,300 | $114,700 |
| 2014 | $6,165 | $260,000 | $145,300 | $114,700 |
Source: Public Records
Map
Nearby Homes
- 4 Ikes Ln
- 98 Main St
- 17 Church St
- 45 Terrace St
- 43 Terrace St
- 26 Maple Ave
- 23 Ledgewood Ave
- 74 Main St
- 79 Main St
- 8 Oak St
- 81 Main St
- 16 Old Ledgewood Rd
- 23 Amendola Dr
- 16-18 King St
- 18 Dell Ave
- 60 Silas Rd Unit H
- 5 Mcmullen St
- Lehigh Plan at Mount Olive Grove - Singles
- Columbia Plan at Mount Olive Grove - Singles
- Ballenger Plan at Mount Olive Grove - Singles
- 14 Flanders Rd
- 18 Flanders Rd
- 20 Flanders Rd
- 22 Flanders Rd
- 25 Flanders Rd
- 3 Ikes Ln
- 24 Flanders Rd
- 27 Flanders Rd
- 27 Flanders Rd Unit 1
- 28 Flanders Rd
- 2 Flanders Rd Unit 220
- 2 Flanders Rd Unit 210
- 2 Flanders Rd
- 31 Flanders Rd
- 6 Ikes Ln
- 30 Flanders Rd
- 5 Ikes Ln
- 102 Main St
- 32 Flanders Rd
- 100 Main St