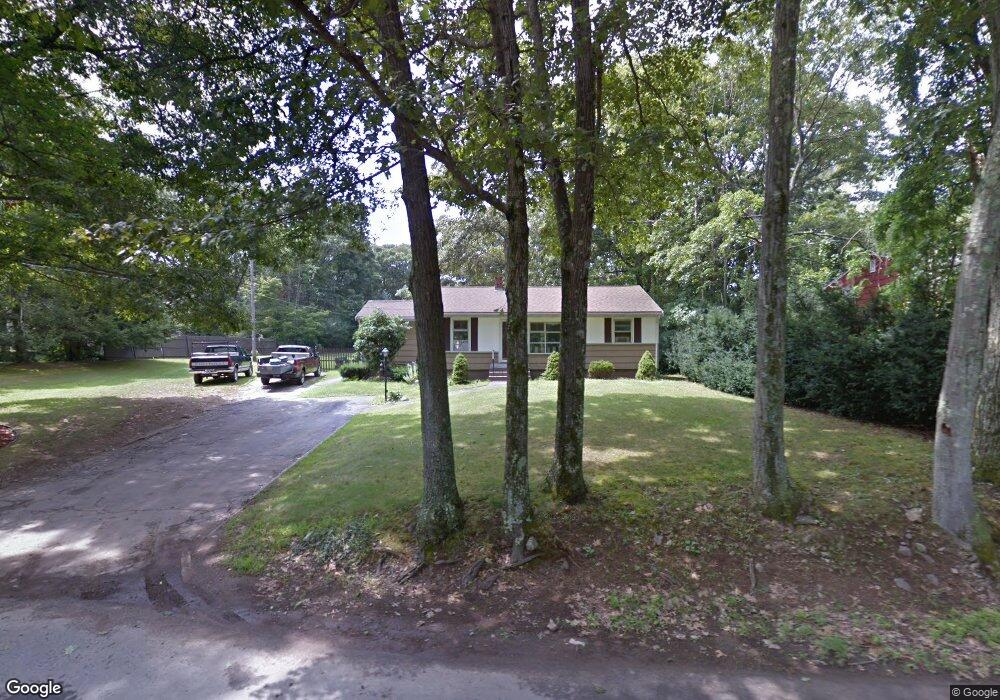
17 Fletcher St Plainville, MA 02762
Estimated Value: $492,000 - $540,000
3
Beds
1
Bath
1,084
Sq Ft
$472/Sq Ft
Est. Value
About This Home
This home is located at 17 Fletcher St, Plainville, MA 02762 and is currently estimated at $511,784, approximately $472 per square foot. 17 Fletcher St is a home located in Norfolk County with nearby schools including Anna Ware Jackson School, Beatrice H. Wood Elementary School, and Cadence Academy Preschool - North Attleborough.
Ownership History
Date
Name
Owned For
Owner Type
Purchase Details
Closed on
May 4, 2020
Sold by
Snyder Neal K
Bought by
Snyder Neal K and Snyder Courtney R
Current Estimated Value
Purchase Details
Closed on
Oct 2, 2014
Sold by
Snyder Gerald L and Wainwright Stephen R
Bought by
Snyder Neal K
Home Financials for this Owner
Home Financials are based on the most recent Mortgage that was taken out on this home.
Original Mortgage
$15,000
Interest Rate
4.11%
Mortgage Type
New Conventional
Create a Home Valuation Report for This Property
The Home Valuation Report is an in-depth analysis detailing your home's value as well as a comparison with similar homes in the area
Home Values in the Area
Average Home Value in this Area
Purchase History
| Date | Buyer | Sale Price | Title Company |
|---|---|---|---|
| Snyder Neal K | -- | None Available | |
| Snyder Neal K | -- | -- |
Source: Public Records
Mortgage History
| Date | Status | Borrower | Loan Amount |
|---|---|---|---|
| Previous Owner | Snyder Neal K | $15,000 |
Source: Public Records
Tax History Compared to Growth
Tax History
| Year | Tax Paid | Tax Assessment Tax Assessment Total Assessment is a certain percentage of the fair market value that is determined by local assessors to be the total taxable value of land and additions on the property. | Land | Improvement |
|---|---|---|---|---|
| 2025 | $50 | $434,400 | $242,700 | $191,700 |
| 2024 | $4,723 | $393,600 | $219,400 | $174,200 |
| 2023 | $4,584 | $367,300 | $219,400 | $147,900 |
| 2022 | $4,370 | $311,500 | $211,400 | $100,100 |
| 2021 | $4,239 | $288,400 | $193,000 | $95,400 |
| 2020 | $4,128 | $280,800 | $193,000 | $87,800 |
| 2019 | $3,949 | $263,800 | $183,800 | $80,000 |
| 2018 | $3,527 | $234,200 | $175,000 | $59,200 |
| 2017 | $3,636 | $242,400 | $175,000 | $67,400 |
| 2016 | $3,629 | $244,700 | $175,000 | $69,700 |
| 2015 | $3,440 | $223,100 | $150,400 | $72,700 |
| 2014 | $3,354 | $224,200 | $150,400 | $73,800 |
Source: Public Records
Map
Nearby Homes
- 16 Elizabeth St
- 145 W Bacon St
- 105 W Bacon St
- 45 Moran St
- 10 Cliff Dr
- 35-R Whiting St
- 20 South St
- 5 Farm Hill Ln
- 3 Field Dr
- 12 Morgan Way Unit 1
- 9 Leonard St
- 10 Legion Dr
- 64 Smith St
- 230 South St
- 1066 Mount Hope St
- 6 Hilltop Rd Unit 122
- 68 Fisher St
- 99 Arnold Rd
- 8 Al Pace Dr Unit 8
- 19 Church St Unit A5