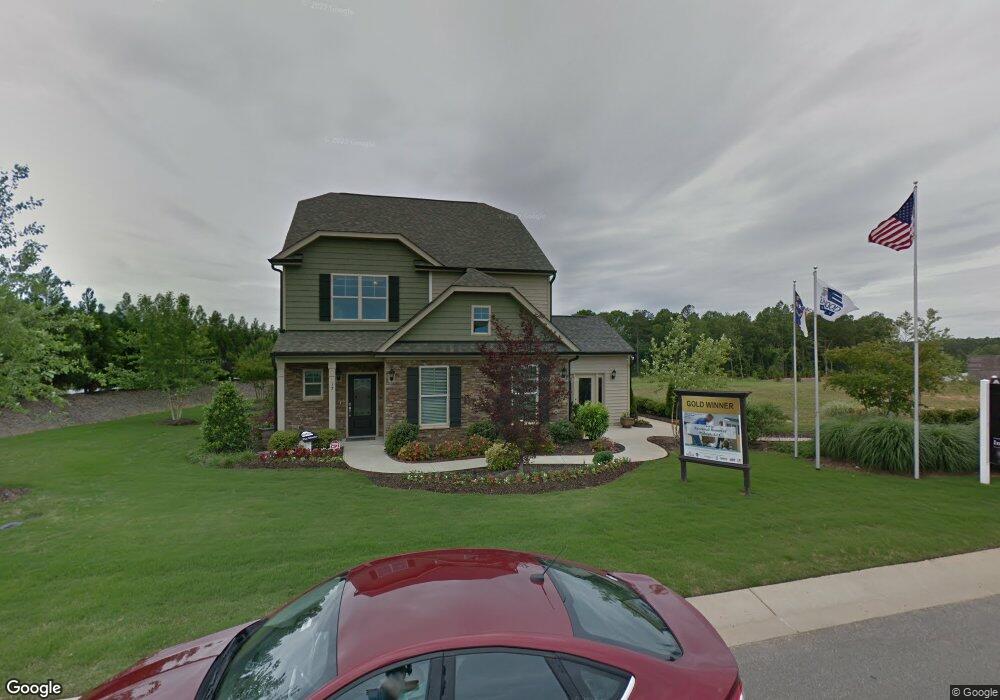
17 Flowers Crest Way Clayton, NC 27527
Wilders NeighborhoodEstimated Value: $417,000 - $477,000
3
Beds
4
Baths
2,586
Sq Ft
$169/Sq Ft
Est. Value
About This Home
This home is located at 17 Flowers Crest Way, Clayton, NC 27527 and is currently estimated at $437,939, approximately $169 per square foot. 17 Flowers Crest Way is a home located in Johnston County with nearby schools including River Dell Elementary School, Archer Lodge Middle School, and Corinth Holders High School.
Ownership History
Date
Name
Owned For
Owner Type
Purchase Details
Closed on
Jul 8, 2020
Sold by
Long Lawrence Michael and Long Elizabeth B
Bought by
Schurr Timothy David and Fernandez Rosa
Current Estimated Value
Home Financials for this Owner
Home Financials are based on the most recent Mortgage that was taken out on this home.
Original Mortgage
$248,000
Outstanding Balance
$219,910
Interest Rate
3.1%
Mortgage Type
New Conventional
Estimated Equity
$218,029
Purchase Details
Closed on
Aug 9, 2017
Sold by
Eastwood Homes Of Raleigh Llc
Bought by
Long Lawrence Michael and Long Elizabeth B
Home Financials for this Owner
Home Financials are based on the most recent Mortgage that was taken out on this home.
Original Mortgage
$289,136
Interest Rate
3.88%
Mortgage Type
New Conventional
Create a Home Valuation Report for This Property
The Home Valuation Report is an in-depth analysis detailing your home's value as well as a comparison with similar homes in the area
Home Values in the Area
Average Home Value in this Area
Purchase History
| Date | Buyer | Sale Price | Title Company |
|---|---|---|---|
| Schurr Timothy David | $310,000 | None Available | |
| Long Lawrence Michael | $280,000 | None Available |
Source: Public Records
Mortgage History
| Date | Status | Borrower | Loan Amount |
|---|---|---|---|
| Open | Schurr Timothy David | $248,000 | |
| Previous Owner | Long Lawrence Michael | $289,136 |
Source: Public Records
Tax History Compared to Growth
Tax History
| Year | Tax Paid | Tax Assessment Tax Assessment Total Assessment is a certain percentage of the fair market value that is determined by local assessors to be the total taxable value of land and additions on the property. | Land | Improvement |
|---|---|---|---|---|
| 2025 | $2,542 | $400,340 | $65,000 | $335,340 |
| 2024 | $2,148 | $265,170 | $40,000 | $225,170 |
| 2023 | $2,148 | $265,170 | $40,000 | $225,170 |
| 2022 | $2,174 | $265,170 | $40,000 | $225,170 |
| 2021 | $2,174 | $265,170 | $40,000 | $225,170 |
| 2020 | $2,231 | $262,480 | $40,000 | $222,480 |
| 2019 | $2,231 | $262,480 | $40,000 | $222,480 |
| 2018 | $2,006 | $230,590 | $35,000 | $195,590 |
| 2017 | $1,889 | $222,180 | $35,000 | $187,180 |
| 2016 | $1,889 | $222,180 | $35,000 | $187,180 |
| 2015 | $1,889 | $222,180 | $35,000 | $187,180 |
| 2014 | $1,889 | $222,180 | $35,000 | $187,180 |
Source: Public Records
Map
Nearby Homes
- 65 N Wilders Ridge Way
- 46 Woods Manor Ln
- 107 Thornbury St
- 362 Beckwith Ave
- 287 Flowers Crest Way
- 47 White Pine Dr
- 88 White Pine Dr
- 65 Balsam Ln
- 112 River Dell Townes Ave
- 225 Beckwith Ave
- 113 Somers Ln
- 107 Bella Casa Way
- 537 Bramble Ln
- 80 Bramble Ln
- 59 Blue Spruce Cir
- 67 Blue Spruce Cir
- 42 Tybee Creek Cove
- 366 Bramble Ln
- 72 Little Leaf Ln
- 80 Willow Green Dr
- 31 Flowers Crest Way
- 90 Calvert Ct
- 43 Flowers Crest Way
- 10 Kenilworth St
- 90 E Calvert Ct
- 101 Wilders Woods Grove Ln
- 117 Wilders Woods Grove Ln
- 89 Wilders Woods Grove Ln
- 95 E Calvert Ct
- 95 Calvert Ct
- 55 Flowers Crest Way
- 20 Kenilworth St
- 75 Wilders Woods Grove Ln
- 13 Kenilworth St
- 84 Calvert Ct
- 84 E Calvert Ct
- 127 Wilders Woods Grove Ln
- 67 Flowers Crest Way
- 61 Wilders Woods Grove Ln
- 32 Kenilworth St