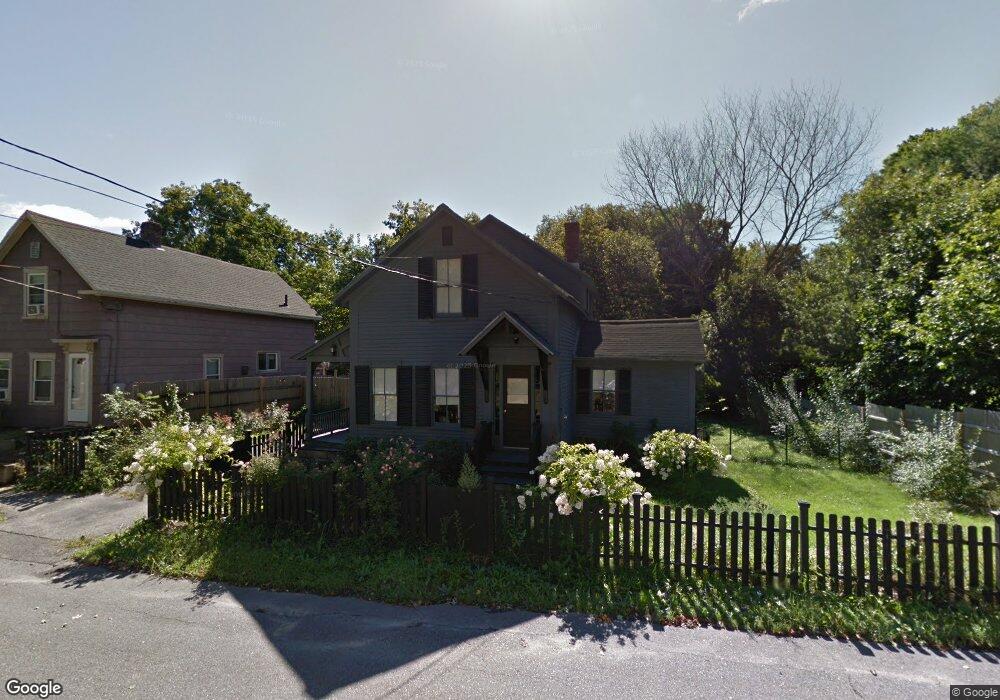
17 Forest St Concord, NH 03301
North End NeighborhoodEstimated Value: $381,000 - $434,000
3
Beds
1
Bath
1,318
Sq Ft
$305/Sq Ft
Est. Value
About This Home
This home is located at 17 Forest St, Concord, NH 03301 and is currently estimated at $402,504, approximately $305 per square foot. 17 Forest St is a home located in Merrimack County with nearby schools including Christa McAuliffe School, Rundlett Middle School, and Concord High School.
Ownership History
Date
Name
Owned For
Owner Type
Purchase Details
Closed on
Dec 1, 2008
Sold by
Gannett Dennis B and Gannett Diana J
Bought by
Simberkoff Michael S and Simberkoff Eleanor
Current Estimated Value
Home Financials for this Owner
Home Financials are based on the most recent Mortgage that was taken out on this home.
Original Mortgage
$160,000
Interest Rate
6.47%
Mortgage Type
Purchase Money Mortgage
Create a Home Valuation Report for This Property
The Home Valuation Report is an in-depth analysis detailing your home's value as well as a comparison with similar homes in the area
Home Values in the Area
Average Home Value in this Area
Purchase History
| Date | Buyer | Sale Price | Title Company |
|---|---|---|---|
| Simberkoff Michael S | $200,000 | -- |
Source: Public Records
Mortgage History
| Date | Status | Borrower | Loan Amount |
|---|---|---|---|
| Open | Simberkoff Michael S | $140,500 | |
| Closed | Simberkoff Michael S | $155,000 | |
| Closed | Simberkoff Michael S | $160,000 |
Source: Public Records
Tax History
| Year | Tax Paid | Tax Assessment Tax Assessment Total Assessment is a certain percentage of the fair market value that is determined by local assessors to be the total taxable value of land and additions on the property. | Land | Improvement |
|---|---|---|---|---|
| 2025 | $7,516 | $258,200 | $111,200 | $147,000 |
| 2024 | $7,557 | $272,900 | $111,200 | $161,700 |
| 2023 | $7,330 | $272,900 | $111,200 | $161,700 |
| 2022 | $7,065 | $272,900 | $111,200 | $161,700 |
| 2021 | $6,772 | $269,600 | $111,200 | $158,400 |
| 2020 | $6,366 | $237,900 | $88,800 | $149,100 |
| 2019 | $5,956 | $214,400 | $85,900 | $128,500 |
| 2018 | $5,909 | $209,600 | $82,400 | $127,200 |
| 2017 | $5,608 | $198,600 | $80,300 | $118,300 |
| 2016 | $5,454 | $197,100 | $80,300 | $116,800 |
| 2015 | $5,039 | $184,300 | $80,300 | $104,000 |
| 2014 | $4,941 | $184,300 | $80,300 | $104,000 |
| 2013 | -- | $180,200 | $80,300 | $99,900 |
| 2012 | -- | $197,100 | $80,300 | $116,800 |
Source: Public Records
Map
Nearby Homes
Your Personal Tour Guide
Ask me questions while you tour the home.