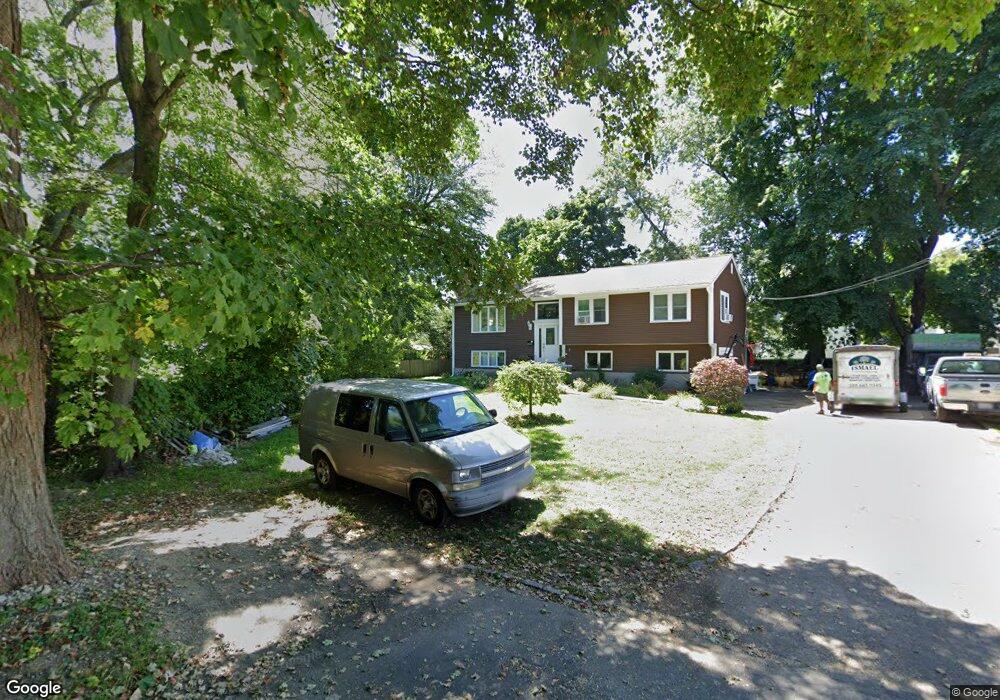
17 Foss Rd Framingham, MA 01702
Estimated Value: $610,000 - $711,731
3
Beds
4
Baths
1,248
Sq Ft
$538/Sq Ft
Est. Value
About This Home
This home is located at 17 Foss Rd, Framingham, MA 01702 and is currently estimated at $671,433, approximately $538 per square foot. 17 Foss Rd is a home located in Middlesex County with nearby schools including Framingham High School, Happy Hollow School, and Pincushion Hill Montessori School.
Ownership History
Date
Name
Owned For
Owner Type
Purchase Details
Closed on
Oct 23, 2001
Sold by
Marcoaldi Alex and Trudel Kimberly
Bought by
Coelho Geraldo J and Coelho Maria Alice
Current Estimated Value
Home Financials for this Owner
Home Financials are based on the most recent Mortgage that was taken out on this home.
Original Mortgage
$246,000
Outstanding Balance
$96,504
Interest Rate
6.92%
Mortgage Type
Purchase Money Mortgage
Estimated Equity
$574,929
Create a Home Valuation Report for This Property
The Home Valuation Report is an in-depth analysis detailing your home's value as well as a comparison with similar homes in the area
Home Values in the Area
Average Home Value in this Area
Purchase History
| Date | Buyer | Sale Price | Title Company |
|---|---|---|---|
| Coelho Geraldo J | $307,500 | -- | |
| Coelho Geraldo J | $307,500 | -- |
Source: Public Records
Mortgage History
| Date | Status | Borrower | Loan Amount |
|---|---|---|---|
| Open | Coelho Geraldo J | $246,000 | |
| Closed | Coelho Geraldo J | $246,000 |
Source: Public Records
Tax History Compared to Growth
Tax History
| Year | Tax Paid | Tax Assessment Tax Assessment Total Assessment is a certain percentage of the fair market value that is determined by local assessors to be the total taxable value of land and additions on the property. | Land | Improvement |
|---|---|---|---|---|
| 2025 | $8,037 | $673,100 | $203,900 | $469,200 |
| 2024 | $7,563 | $607,000 | $181,300 | $425,700 |
| 2023 | $7,211 | $550,900 | $162,000 | $388,900 |
| 2022 | $6,865 | $499,600 | $147,000 | $352,600 |
| 2021 | $6,775 | $482,200 | $141,200 | $341,000 |
| 2020 | $6,805 | $454,300 | $123,100 | $331,200 |
| 2019 | $6,698 | $435,500 | $117,300 | $318,200 |
| 2018 | $6,559 | $401,900 | $109,200 | $292,700 |
| 2017 | $6,303 | $377,200 | $105,200 | $272,000 |
| 2016 | $6,092 | $350,500 | $99,400 | $251,100 |
| 2015 | $5,970 | $335,000 | $100,400 | $234,600 |
Source: Public Records
Map
Nearby Homes
- 15 Bates Rd
- 72 Pond St
- 131 Mellen St Unit 3B
- 84 Bethany Rd
- 302 Hollis St Unit R
- 292 Hollis St
- 34 Charles St
- 25 Eames St
- 39 Bethany Rd
- 77 Arlington St
- 29 Gordon St Unit 107
- 37 James Rd
- 16 Alexander St
- 45 Daytona Ave
- 818 Waverly St
- 158 Algonquin Trail
- 45 Half Crown Cir
- 379 Captain Eames Cir
- 7 Weld St Unit 50
- 7 Weld St Unit 35