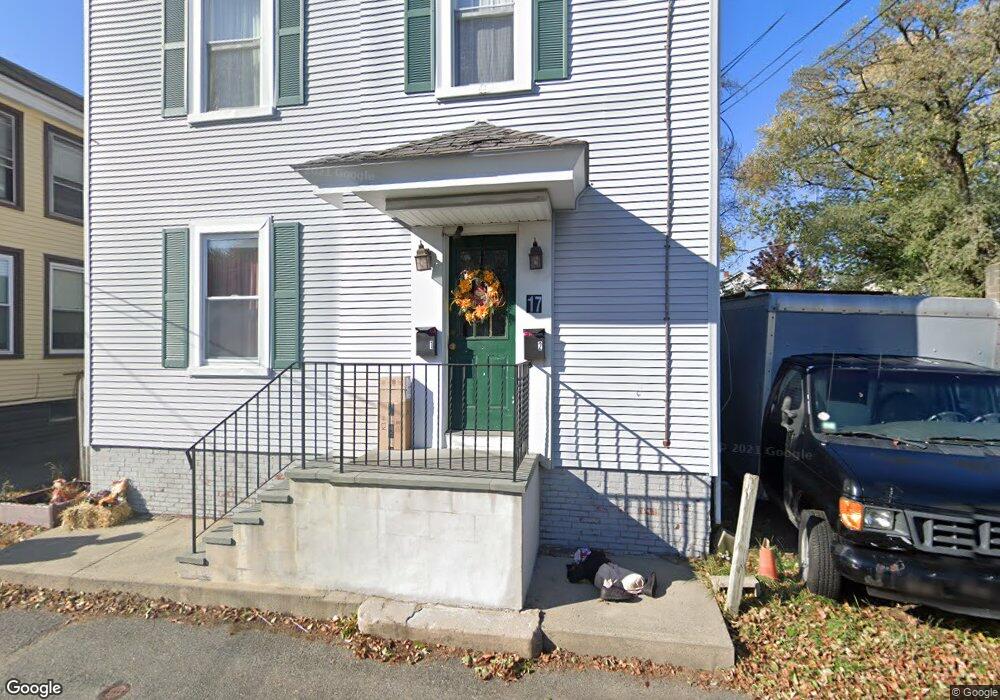
17 Foster St Unit 2 Salem, MA 01970
North Salem NeighborhoodEstimated Value: $654,000 - $848,000
3
Beds
1
Bath
1,850
Sq Ft
$406/Sq Ft
Est. Value
About This Home
This home is located at 17 Foster St Unit 2, Salem, MA 01970 and is currently estimated at $751,278, approximately $406 per square foot. 17 Foster St Unit 2 is a home located in Essex County with nearby schools including Bates Elementary School, Saltonstall School, and Carlton Elementary School.
Ownership History
Date
Name
Owned For
Owner Type
Purchase Details
Closed on
Mar 20, 2013
Sold by
Chalifour Claire D
Bought by
Chalifour Family Lp
Current Estimated Value
Home Financials for this Owner
Home Financials are based on the most recent Mortgage that was taken out on this home.
Original Mortgage
$172,402
Outstanding Balance
$121,162
Interest Rate
3.45%
Estimated Equity
$630,116
Purchase Details
Closed on
Dec 14, 2012
Sold by
Chalifour Family Lp
Bought by
Chalifour Claire D
Purchase Details
Closed on
May 22, 2009
Sold by
Chalifour Claire D
Bought by
Chalifour Ft Lp
Create a Home Valuation Report for This Property
The Home Valuation Report is an in-depth analysis detailing your home's value as well as a comparison with similar homes in the area
Home Values in the Area
Average Home Value in this Area
Purchase History
| Date | Buyer | Sale Price | Title Company |
|---|---|---|---|
| Chalifour Family Lp | -- | -- | |
| Chalifour Claire D | -- | -- | |
| Chalifour Ft Lp | -- | -- |
Source: Public Records
Mortgage History
| Date | Status | Borrower | Loan Amount |
|---|---|---|---|
| Open | Chalifour Ft Lp | $172,402 | |
| Previous Owner | Chalifour Ft Lp | $10,000 |
Source: Public Records
Tax History Compared to Growth
Tax History
| Year | Tax Paid | Tax Assessment Tax Assessment Total Assessment is a certain percentage of the fair market value that is determined by local assessors to be the total taxable value of land and additions on the property. | Land | Improvement |
|---|---|---|---|---|
| 2025 | $6,312 | $556,600 | $160,000 | $396,600 |
| 2024 | $6,040 | $519,800 | $151,600 | $368,200 |
| 2023 | $5,842 | $467,000 | $140,300 | $326,700 |
| 2022 | $5,963 | $450,000 | $131,900 | $318,100 |
| 2021 | $5,778 | $418,700 | $131,900 | $286,800 |
| 2020 | $5,523 | $382,200 | $114,000 | $268,200 |
| 2019 | $5,332 | $353,100 | $108,300 | $244,800 |
| 2018 | $4,909 | $319,200 | $103,300 | $215,900 |
| 2017 | $4,533 | $285,800 | $84,200 | $201,600 |
| 2016 | $4,408 | $281,300 | $79,700 | $201,600 |
| 2015 | $4,252 | $259,100 | $71,900 | $187,200 |
Source: Public Records
Map
Nearby Homes
- 112 North St
- 8 Upham St
- 18 Franklin St Unit 303
- 3 S Mason St
- 41 Dearborn St
- 5 Larchmont Rd Unit 3
- 78 Federal St
- 47 Federal St
- 27 Appleton St
- 0 Lot 41 Map 10 Unit 73335079
- 0 Lot 61 Map 10 Unit 73335091
- 15 Lynde St Unit 26
- 304 Essex St Unit 1
- 156 Bridge St Unit B
- 289 Essex St Unit 307
- 11 Summer St
- 8 Williams St Unit 2
- 140 Washington St Unit 1C
- 26 Winter St
- 103 Bridge St Unit 2
- 17 Foster St
- 18 Osborne St
- 21 Foster St
- 20 Osborne St
- 16 Osborne St
- 22 Osborne St
- 14 Foster St
- 12 Foster St
- 18 Foster St
- 16 Foster St
- 11 Foster St
- 14 Osborne St Unit 2
- 14 Osborne St Unit 1
- 14 Osborne St Unit 14 Osborne
- 25 Foster St
- 25 Foster St Unit 1
- 12 Osborne St Unit 2
- 12 Osborne St Unit 1
- 12 Osborne St
- 12 1/2 Osborne St Unit 1