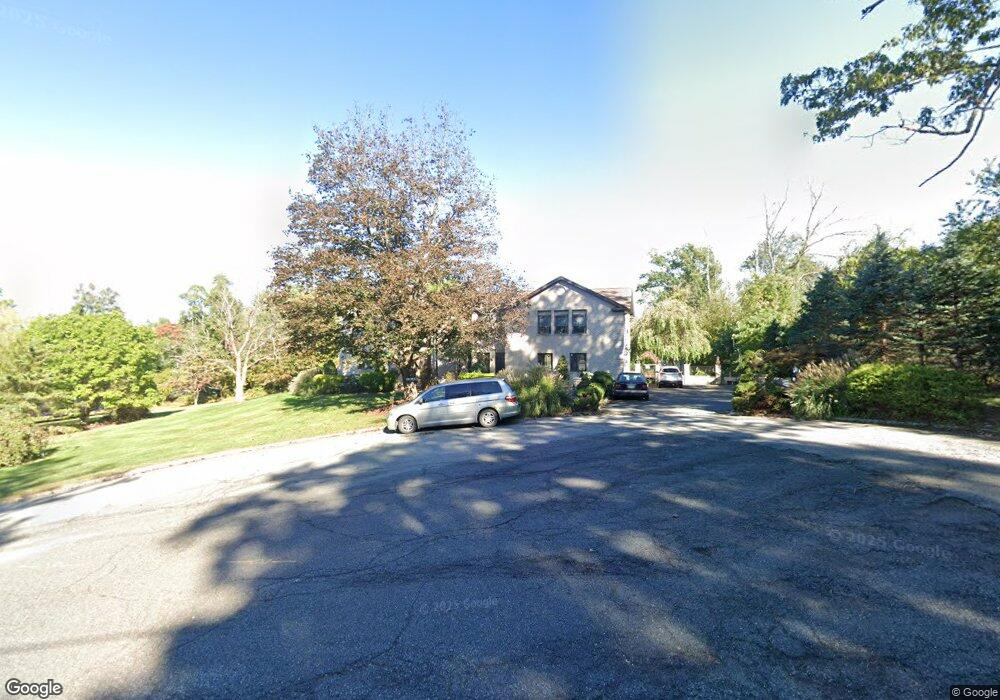
17 Fox Hill Dr Warren, NJ 07059
Estimated Value: $1,230,521 - $1,607,000
--
Bed
--
Bath
3,725
Sq Ft
$365/Sq Ft
Est. Value
About This Home
This home is located at 17 Fox Hill Dr, Warren, NJ 07059 and is currently estimated at $1,357,880, approximately $364 per square foot. 17 Fox Hill Dr is a home located in Somerset County with nearby schools including Central School, Warren Middle School, and Watchung Hills Regional High School.
Ownership History
Date
Name
Owned For
Owner Type
Purchase Details
Closed on
Sep 6, 2007
Sold by
Rodriguez Jose
Bought by
Tam Albert H and Tam Eisel A
Current Estimated Value
Home Financials for this Owner
Home Financials are based on the most recent Mortgage that was taken out on this home.
Original Mortgage
$515,000
Outstanding Balance
$320,674
Interest Rate
6.25%
Mortgage Type
Purchase Money Mortgage
Estimated Equity
$1,037,206
Create a Home Valuation Report for This Property
The Home Valuation Report is an in-depth analysis detailing your home's value as well as a comparison with similar homes in the area
Home Values in the Area
Average Home Value in this Area
Purchase History
| Date | Buyer | Sale Price | Title Company |
|---|---|---|---|
| Tam Albert H | $915,000 | None Available |
Source: Public Records
Mortgage History
| Date | Status | Borrower | Loan Amount |
|---|---|---|---|
| Open | Tam Albert H | $515,000 |
Source: Public Records
Tax History Compared to Growth
Tax History
| Year | Tax Paid | Tax Assessment Tax Assessment Total Assessment is a certain percentage of the fair market value that is determined by local assessors to be the total taxable value of land and additions on the property. | Land | Improvement |
|---|---|---|---|---|
| 2025 | $16,349 | $968,400 | $417,200 | $551,200 |
| 2024 | $16,349 | $889,500 | $374,900 | $514,600 |
| 2023 | $16,120 | $831,800 | $347,100 | $484,700 |
| 2022 | $15,890 | $799,700 | $335,000 | $464,700 |
| 2021 | $16,053 | $773,500 | $322,200 | $451,300 |
| 2020 | $15,864 | $766,400 | $315,900 | $450,500 |
| 2019 | $15,619 | $766,400 | $315,900 | $450,500 |
| 2018 | $16,009 | $805,700 | $353,700 | $452,000 |
| 2017 | $15,890 | $799,300 | $327,400 | $471,900 |
| 2016 | $15,891 | $791,000 | $327,400 | $463,600 |
| 2015 | $15,485 | $756,100 | $297,500 | $458,600 |
| 2014 | $14,530 | $713,300 | $278,000 | $435,300 |
Source: Public Records
Map
Nearby Homes