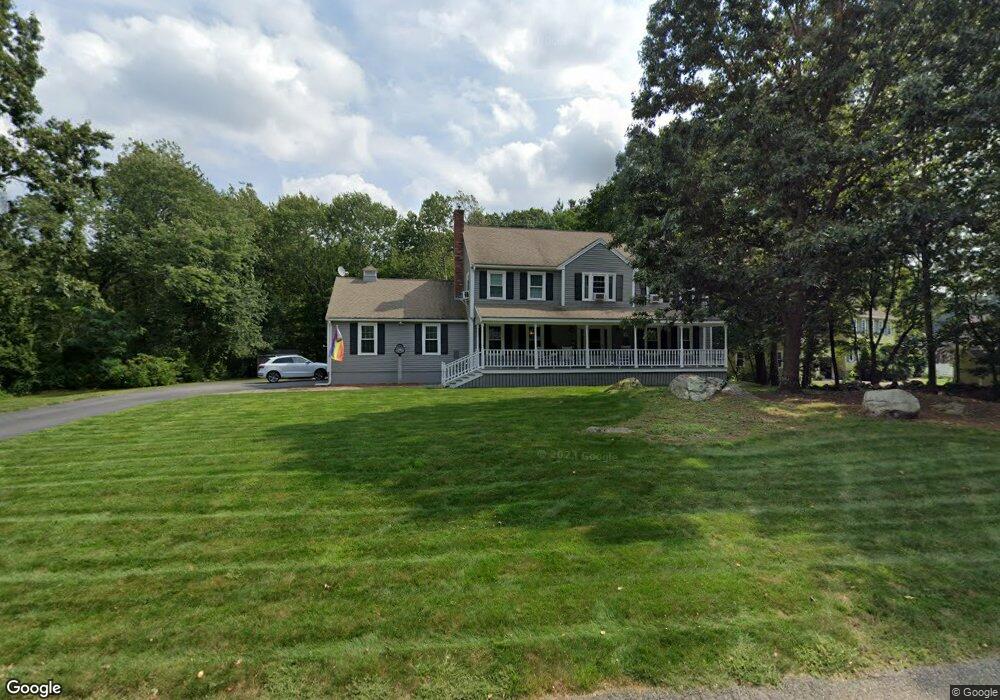
17 Fox Run Rd Medway, MA 02053
Estimated Value: $779,797 - $934,000
4
Beds
3
Baths
2,568
Sq Ft
$331/Sq Ft
Est. Value
About This Home
This home is located at 17 Fox Run Rd, Medway, MA 02053 and is currently estimated at $850,449, approximately $331 per square foot. 17 Fox Run Rd is a home located in Norfolk County with nearby schools including John D. McGovern Elementary School, Burke-Memorial Elementary, and Medway Middle School.
Ownership History
Date
Name
Owned For
Owner Type
Purchase Details
Closed on
Aug 28, 2007
Sold by
Mcelhinney Ann M and Mcelhinney Steve J
Bought by
Smith David B and Archambault Dawn M
Current Estimated Value
Home Financials for this Owner
Home Financials are based on the most recent Mortgage that was taken out on this home.
Original Mortgage
$380,000
Outstanding Balance
$243,167
Interest Rate
6.78%
Mortgage Type
Purchase Money Mortgage
Estimated Equity
$607,282
Purchase Details
Closed on
Jun 21, 2004
Sold by
Benedict Bertrand A and Benedict Frances G
Bought by
Mcelhinney Ann M and Mcelhinney Steve J
Home Financials for this Owner
Home Financials are based on the most recent Mortgage that was taken out on this home.
Original Mortgage
$333,700
Interest Rate
6.12%
Mortgage Type
Purchase Money Mortgage
Create a Home Valuation Report for This Property
The Home Valuation Report is an in-depth analysis detailing your home's value as well as a comparison with similar homes in the area
Home Values in the Area
Average Home Value in this Area
Purchase History
| Date | Buyer | Sale Price | Title Company |
|---|---|---|---|
| Smith David B | $475,000 | -- | |
| Mcelhinney Ann M | $517,500 | -- |
Source: Public Records
Mortgage History
| Date | Status | Borrower | Loan Amount |
|---|---|---|---|
| Open | Smith David B | $380,000 | |
| Closed | Smith David B | $38,000 | |
| Previous Owner | Mcelhinney Ann M | $333,700 | |
| Previous Owner | Mcelhinney Ann M | $66,800 |
Source: Public Records
Tax History
| Year | Tax Paid | Tax Assessment Tax Assessment Total Assessment is a certain percentage of the fair market value that is determined by local assessors to be the total taxable value of land and additions on the property. | Land | Improvement |
|---|---|---|---|---|
| 2025 | $9,912 | $695,600 | $328,700 | $366,900 |
| 2024 | $10,017 | $695,600 | $328,700 | $366,900 |
| 2023 | $9,935 | $623,300 | $299,200 | $324,100 |
| 2022 | $9,102 | $537,600 | $221,200 | $316,400 |
| 2021 | $9,133 | $523,100 | $206,500 | $316,600 |
| 2020 | $9,109 | $520,500 | $206,500 | $314,000 |
| 2019 | $8,495 | $500,600 | $198,100 | $302,500 |
| 2018 | $8,562 | $484,800 | $189,600 | $295,200 |
| 2017 | $8,482 | $473,300 | $185,400 | $287,900 |
| 2016 | $8,122 | $448,500 | $170,700 | $277,800 |
| 2015 | $8,040 | $440,800 | $168,600 | $272,200 |
| 2014 | $7,802 | $414,100 | $168,600 | $245,500 |
Source: Public Records
Map
Nearby Homes
- 15 Fox Run Rd
- 22 Granite St
- 3 Millbrook Rd
- 8 Liberty Rd
- 56 Fisher St
- 28 Fisher St
- 42 Fisher St
- 462 Hartford Ave
- 4 Beech St
- 21 Carp Rd
- 23 Cedar Farms Rd
- 429 South St
- 2 Kingson Ln Unit 2
- 394 Village St
- 44 Black Bear Cir Unit 44
- 46 Black Bear Cir Unit 46
- 48 Black Bear Cir Unit 48
- 15 Black Bear Cir Unit 15
- 13 Black Bear Cir Unit 13
- 56 Puddingstone Ln
Your Personal Tour Guide
Ask me questions while you tour the home.