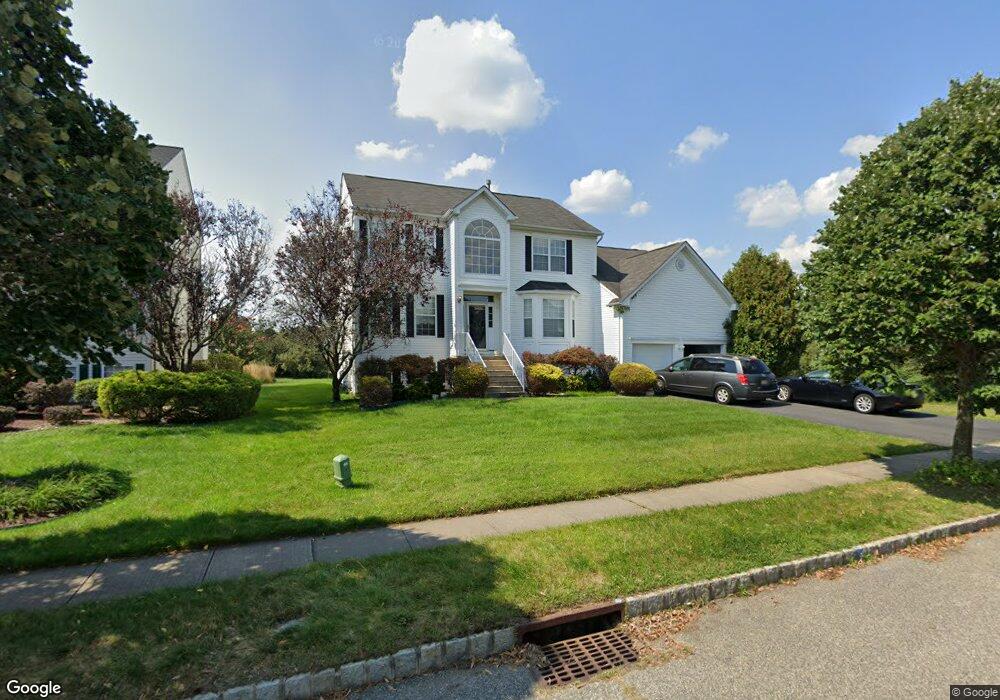
17 Fulham Way East Windsor, NJ 08520
Estimated Value: $787,000 - $895,000
--
Bed
--
Bath
2,440
Sq Ft
$345/Sq Ft
Est. Value
About This Home
This home is located at 17 Fulham Way, East Windsor, NJ 08520 and is currently estimated at $840,705, approximately $344 per square foot. 17 Fulham Way is a home located in Mercer County with nearby schools including Melvin H. Kreps Middle School, Hightstown High School, and SciCore Academy.
Ownership History
Date
Name
Owned For
Owner Type
Purchase Details
Closed on
Jul 17, 2012
Sold by
Koshy Anu P and Koshy Thomas T
Bought by
Koshy Anu P and Koshy Thomas T
Current Estimated Value
Home Financials for this Owner
Home Financials are based on the most recent Mortgage that was taken out on this home.
Interest Rate
3.56%
Purchase Details
Closed on
Nov 1, 2001
Sold by
Calton Homes Llc
Bought by
Koshy Thomas
Home Financials for this Owner
Home Financials are based on the most recent Mortgage that was taken out on this home.
Original Mortgage
$257,271
Interest Rate
6.82%
Create a Home Valuation Report for This Property
The Home Valuation Report is an in-depth analysis detailing your home's value as well as a comparison with similar homes in the area
Home Values in the Area
Average Home Value in this Area
Purchase History
| Date | Buyer | Sale Price | Title Company |
|---|---|---|---|
| Koshy Anu P | -- | -- | |
| Koshy Thomas | $326,577 | -- |
Source: Public Records
Mortgage History
| Date | Status | Borrower | Loan Amount |
|---|---|---|---|
| Closed | Koshy Anu P | -- | |
| Previous Owner | Koshy Thomas | $257,271 |
Source: Public Records
Tax History Compared to Growth
Tax History
| Year | Tax Paid | Tax Assessment Tax Assessment Total Assessment is a certain percentage of the fair market value that is determined by local assessors to be the total taxable value of land and additions on the property. | Land | Improvement |
|---|---|---|---|---|
| 2025 | $16,948 | $455,600 | $166,300 | $289,300 |
| 2024 | $16,046 | $455,600 | $166,300 | $289,300 |
| 2023 | $16,046 | $455,600 | $166,300 | $289,300 |
| 2022 | $15,632 | $455,600 | $166,300 | $289,300 |
| 2021 | $15,518 | $455,600 | $166,300 | $289,300 |
| 2020 | $15,536 | $455,600 | $166,300 | $289,300 |
| 2019 | $15,395 | $455,600 | $166,300 | $289,300 |
| 2018 | $15,194 | $455,600 | $166,300 | $289,300 |
| 2017 | $15,181 | $455,600 | $166,300 | $289,300 |
| 2016 | $14,966 | $455,600 | $166,300 | $289,300 |
| 2015 | $14,675 | $455,600 | $166,300 | $289,300 |
| 2014 | $14,502 | $455,600 | $166,300 | $289,300 |
Source: Public Records
Map
Nearby Homes
- 23 Fulham Way
- 59 Moorsgate Cir
- 4 Wendover Rd
- 24 Stonehedge Dr
- 20 Stonehedge Dr
- 785 Old York Rd
- 648 Old York Rd
- 2 Carriage Ct
- 28 Columbia Ave
- 108 Orchard Ave
- 89 Hickory Corner Rd
- 102 Teal Ct
- 58 Teal Ct
- 17 Winchester Dr
- 302 S Main St
- 107 Hausser Ave
- 569 Route 130
- 201 Morrison Ave
- 104 1st Ave
- 365 Stockton St