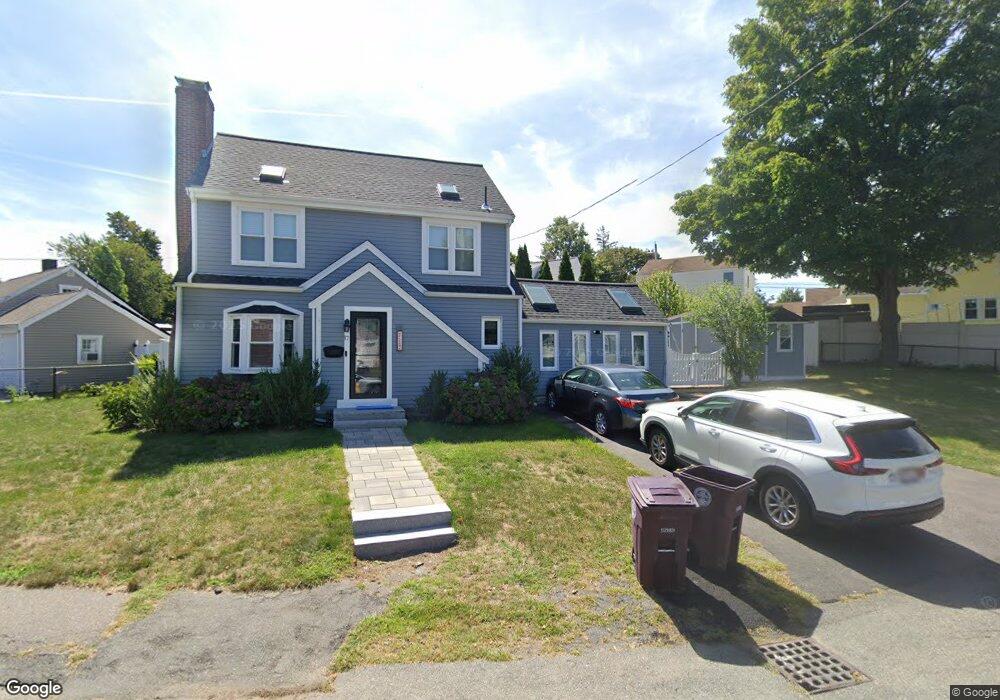
17 Fuller Rd North Weymouth, MA 02191
North Weymouth NeighborhoodEstimated Value: $619,000 - $716,000
3
Beds
3
Baths
1,608
Sq Ft
$422/Sq Ft
Est. Value
About This Home
This home is located at 17 Fuller Rd, North Weymouth, MA 02191 and is currently estimated at $678,424, approximately $421 per square foot. 17 Fuller Rd is a home located in Norfolk County with nearby schools including Wessagusset Elementary School, Abigail Adams Middle School, and Weymouth Middle School Chapman.
Ownership History
Date
Name
Owned For
Owner Type
Purchase Details
Closed on
May 21, 2021
Sold by
Lonczak Kristin
Bought by
Lonczak Jacques Rt and Lonczak
Current Estimated Value
Purchase Details
Closed on
Feb 24, 2020
Sold by
Lonczak Mark and Pavlik Kristen
Bought by
Lonczak Kristin
Home Financials for this Owner
Home Financials are based on the most recent Mortgage that was taken out on this home.
Original Mortgage
$322,400
Interest Rate
3.3%
Mortgage Type
New Conventional
Purchase Details
Closed on
Oct 2, 2002
Sold by
Hall Kevin F and Hall Judith E
Bought by
Lonczak Mark
Home Financials for this Owner
Home Financials are based on the most recent Mortgage that was taken out on this home.
Original Mortgage
$293,000
Interest Rate
6.27%
Mortgage Type
Purchase Money Mortgage
Purchase Details
Closed on
Dec 28, 1987
Sold by
Horan Ann M
Bought by
Hall Kevin
Home Financials for this Owner
Home Financials are based on the most recent Mortgage that was taken out on this home.
Original Mortgage
$116,900
Interest Rate
10.67%
Mortgage Type
Purchase Money Mortgage
Create a Home Valuation Report for This Property
The Home Valuation Report is an in-depth analysis detailing your home's value as well as a comparison with similar homes in the area
Home Values in the Area
Average Home Value in this Area
Purchase History
| Date | Buyer | Sale Price | Title Company |
|---|---|---|---|
| Lonczak Jacques Rt | -- | None Available | |
| Lonczak Kristin | -- | None Available | |
| Lonczak Mark | $310,000 | -- | |
| Lonczak Mark | $310,000 | -- | |
| Hall Kevin | $129,900 | -- |
Source: Public Records
Mortgage History
| Date | Status | Borrower | Loan Amount |
|---|---|---|---|
| Previous Owner | Lonczak Kristin | $322,400 | |
| Previous Owner | Lonczak Mark | $293,000 | |
| Previous Owner | Hall Kevin | $116,900 |
Source: Public Records
Tax History Compared to Growth
Tax History
| Year | Tax Paid | Tax Assessment Tax Assessment Total Assessment is a certain percentage of the fair market value that is determined by local assessors to be the total taxable value of land and additions on the property. | Land | Improvement |
|---|---|---|---|---|
| 2025 | $6,084 | $602,400 | $215,000 | $387,400 |
| 2024 | $5,894 | $573,900 | $204,800 | $369,100 |
| 2023 | $5,430 | $519,600 | $189,600 | $330,000 |
| 2022 | $5,278 | $460,600 | $175,600 | $285,000 |
| 2021 | $4,901 | $417,500 | $175,600 | $241,900 |
| 2020 | $4,648 | $389,900 | $175,600 | $214,300 |
| 2019 | $4,533 | $374,000 | $168,800 | $205,200 |
| 2018 | $4,389 | $351,100 | $160,800 | $190,300 |
| 2017 | $4,197 | $327,600 | $146,200 | $181,400 |
| 2016 | $4,033 | $315,100 | $140,600 | $174,500 |
| 2015 | $3,778 | $292,900 | $133,900 | $159,000 |
| 2014 | $3,540 | $266,200 | $124,600 | $141,600 |
Source: Public Records
Map
Nearby Homes
- 14 Crescent Rd
- 69 Great Hill Dr
- 109 Merryknoll Rd
- 59 Katherine St
- 41 Pecksuot Rd
- 88 Saning Rd
- 65 Saning Rd
- 320 Green St
- 159 Wessagussett Rd
- 137 Wessagussett Rd
- 43 Flint Locke Dr
- 10 Beals Cove Rd Unit C
- 16 Beal's Cove Rd Unit E
- 16 Caldwell St
- 10 Shipyard Dr Unit 313
- 2 Winstead Rd
- 104 Kings Cove Beach Rd
- 504 Tuckers Ln
- 73 Broad Reach Unit M36C
- 73 Broad Reach Unit M21C