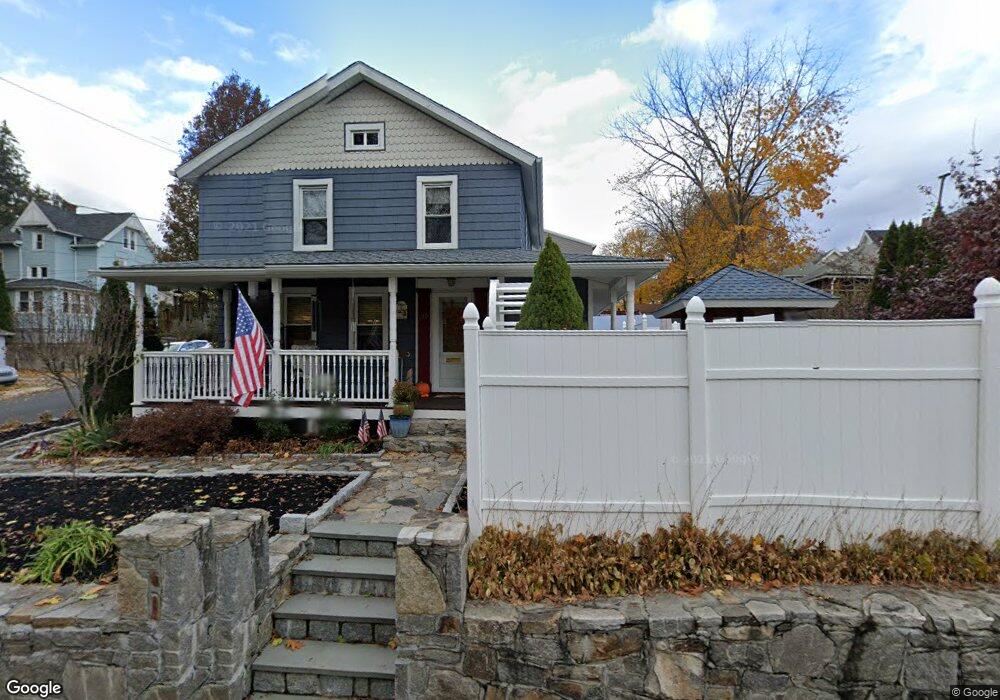
17 Galpin St Naugatuck, CT 06770
Estimated Value: $265,000 - $321,000
2
Beds
1
Bath
1,049
Sq Ft
$276/Sq Ft
Est. Value
About This Home
This home is located at 17 Galpin St, Naugatuck, CT 06770 and is currently estimated at $289,354, approximately $275 per square foot. 17 Galpin St is a home located in New Haven County with nearby schools including City Hill Middle School and Naugatuck High School.
Ownership History
Date
Name
Owned For
Owner Type
Purchase Details
Closed on
May 17, 2006
Sold by
Franklin George and Franklin Natalie
Bought by
Galus Darren and Galus Lorraine
Current Estimated Value
Home Financials for this Owner
Home Financials are based on the most recent Mortgage that was taken out on this home.
Original Mortgage
$172,000
Outstanding Balance
$98,637
Interest Rate
6.42%
Mortgage Type
Purchase Money Mortgage
Estimated Equity
$190,717
Purchase Details
Closed on
Apr 29, 1997
Sold by
Shiravalli Wayne
Bought by
Masse Scott and Masse Sharon
Purchase Details
Closed on
Nov 17, 1989
Sold by
Jaindl Thomas
Bought by
Chiravalli Wayne
Create a Home Valuation Report for This Property
The Home Valuation Report is an in-depth analysis detailing your home's value as well as a comparison with similar homes in the area
Home Values in the Area
Average Home Value in this Area
Purchase History
| Date | Buyer | Sale Price | Title Company |
|---|---|---|---|
| Galus Darren | $215,000 | -- | |
| Masse Scott | $84,500 | -- | |
| Chiravalli Wayne | $124,000 | -- |
Source: Public Records
Mortgage History
| Date | Status | Borrower | Loan Amount |
|---|---|---|---|
| Open | Chiravalli Wayne | $94,000 | |
| Open | Chiravalli Wayne | $172,000 | |
| Closed | Chiravalli Wayne | $43,000 |
Source: Public Records
Tax History Compared to Growth
Tax History
| Year | Tax Paid | Tax Assessment Tax Assessment Total Assessment is a certain percentage of the fair market value that is determined by local assessors to be the total taxable value of land and additions on the property. | Land | Improvement |
|---|---|---|---|---|
| 2025 | $5,108 | $128,380 | $26,600 | $101,780 |
| 2024 | $5,365 | $128,380 | $26,600 | $101,780 |
| 2023 | $5,745 | $128,380 | $26,600 | $101,780 |
| 2022 | $4,353 | $91,160 | $28,480 | $62,680 |
| 2021 | $4,353 | $91,160 | $28,480 | $62,680 |
| 2020 | $4,353 | $91,160 | $28,480 | $62,680 |
| 2019 | $4,307 | $91,160 | $28,480 | $62,680 |
| 2018 | $3,660 | $75,690 | $34,270 | $41,420 |
| 2017 | $3,675 | $75,690 | $34,270 | $41,420 |
| 2016 | $3,608 | $75,690 | $34,270 | $41,420 |
| 2015 | $3,449 | $75,690 | $34,270 | $41,420 |
| 2014 | $3,411 | $75,690 | $34,270 | $41,420 |
| 2012 | $4,225 | $125,930 | $43,260 | $82,670 |
Source: Public Records
Map
Nearby Homes
- 28 Nettleton Ave
- 43 Marshall Ave
- 470 Rubber Ave
- 53 Le Clair Ct
- 155 Hoadley St
- 37 Seth Dr
- 15 Summit Rd
- 25 Walnut Terrace
- 198 Scott St
- 150 Scott St
- 66 N Hoadley St
- 128 Melbourne Ct
- 0 Andrew Mountain Rd Unit 170603648
- 44 Arch St
- 89 N Hoadley St
- 22 Lewis St
- 671 Rubber Ave
- 92 Birch Ln
- 627 Millville Ave Unit 9-8
- 239 Lewis St