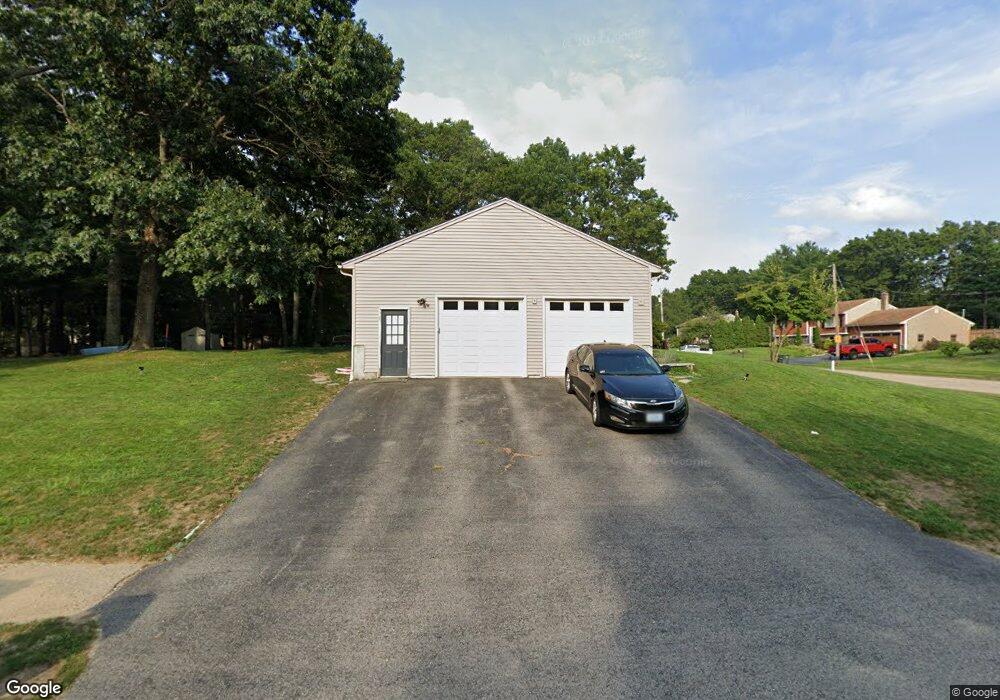
17 Garfield Dr Coventry, RI 02816
Estimated Value: $458,621 - $494,000
3
Beds
2
Baths
1,348
Sq Ft
$354/Sq Ft
Est. Value
About This Home
This home is located at 17 Garfield Dr, Coventry, RI 02816 and is currently estimated at $477,405, approximately $354 per square foot. 17 Garfield Dr is a home located in Kent County with nearby schools including Alan Shawn Feinstein Ms Of Cov, Coventry High School, and Father John V. Doyle School.
Ownership History
Date
Name
Owned For
Owner Type
Purchase Details
Closed on
Oct 12, 2018
Sold by
Tucker David J
Bought by
Tucker David J and Tucker Halley B
Current Estimated Value
Purchase Details
Closed on
Mar 1, 2005
Sold by
Drechsler Jane L
Bought by
Tucker David J and Tucker Kristen A
Create a Home Valuation Report for This Property
The Home Valuation Report is an in-depth analysis detailing your home's value as well as a comparison with similar homes in the area
Purchase History
| Date | Buyer | Sale Price | Title Company |
|---|---|---|---|
| Tucker David J | -- | None Available | |
| Tucker David J | $259,900 | -- |
Source: Public Records
Mortgage History
| Date | Status | Borrower | Loan Amount |
|---|---|---|---|
| Previous Owner | Tucker David J | $196,300 | |
| Previous Owner | Tucker David J | $58,000 |
Source: Public Records
Tax History
| Year | Tax Paid | Tax Assessment Tax Assessment Total Assessment is a certain percentage of the fair market value that is determined by local assessors to be the total taxable value of land and additions on the property. | Land | Improvement |
|---|---|---|---|---|
| 2025 | $5,413 | $336,400 | $128,900 | $207,500 |
| 2024 | $5,413 | $341,700 | $128,900 | $212,800 |
| 2023 | $5,238 | $341,700 | $128,900 | $212,800 |
| 2022 | $5,145 | $262,900 | $122,000 | $140,900 |
| 2021 | $5,100 | $262,900 | $122,000 | $140,900 |
| 2020 | $5,847 | $262,900 | $122,000 | $140,900 |
| 2019 | $5,044 | $226,800 | $98,600 | $128,200 |
| 2018 | $4,901 | $226,800 | $98,600 | $128,200 |
| 2017 | $4,758 | $226,800 | $98,600 | $128,200 |
| 2016 | $4,774 | $223,000 | $108,000 | $115,000 |
| 2015 | $4,645 | $223,000 | $108,000 | $115,000 |
| 2014 | $4,549 | $223,000 | $108,000 | $115,000 |
| 2013 | $4,087 | $219,000 | $101,100 | $117,900 |
Source: Public Records
Map
Nearby Homes
Your Personal Tour Guide
Ask me questions while you tour the home.