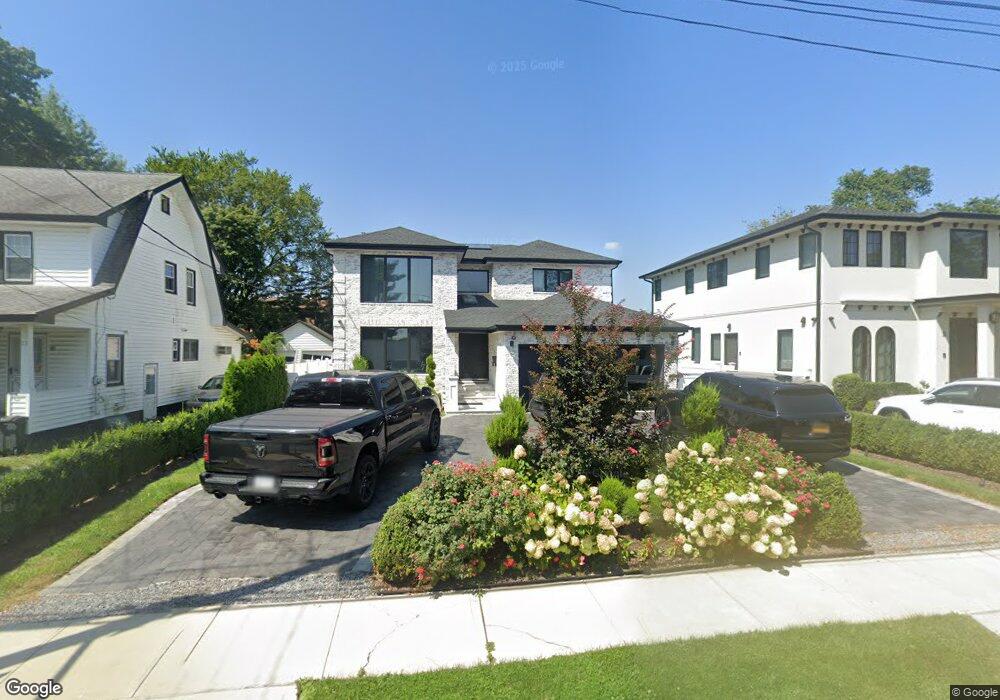
17 Garfield Place Roslyn Heights, NY 11577
Estimated Value: $1,526,000 - $1,702,141
4
Beds
3
Baths
2,856
Sq Ft
$565/Sq Ft
Est. Value
About This Home
This home is located at 17 Garfield Place, Roslyn Heights, NY 11577 and is currently estimated at $1,614,071, approximately $565 per square foot. 17 Garfield Place is a home located in Nassau County with nearby schools including Roslyn Middle School, Roslyn High School, and Henry Viscardi School.
Ownership History
Date
Name
Owned For
Owner Type
Purchase Details
Closed on
Jan 29, 2016
Sold by
Mok Kyung
Bought by
Laskaris Ioannis
Current Estimated Value
Home Financials for this Owner
Home Financials are based on the most recent Mortgage that was taken out on this home.
Original Mortgage
$625,000
Outstanding Balance
$499,368
Interest Rate
4.02%
Mortgage Type
New Conventional
Estimated Equity
$1,114,703
Purchase Details
Closed on
Oct 15, 2010
Sold by
Mok Jin
Bought by
Mok Kyung
Purchase Details
Closed on
Jul 9, 1999
Sold by
Highland Home Builders Inc
Bought by
Hong Soo Hwa
Home Financials for this Owner
Home Financials are based on the most recent Mortgage that was taken out on this home.
Original Mortgage
$400,000
Interest Rate
7.49%
Mortgage Type
Purchase Money Mortgage
Purchase Details
Closed on
Mar 23, 1998
Sold by
Teitel Teresa
Bought by
Highland Home Builders Inc
Create a Home Valuation Report for This Property
The Home Valuation Report is an in-depth analysis detailing your home's value as well as a comparison with similar homes in the area
Home Values in the Area
Average Home Value in this Area
Purchase History
| Date | Buyer | Sale Price | Title Company |
|---|---|---|---|
| Laskaris Ioannis | $925,000 | Judicial Title | |
| Mok Kyung | -- | -- | |
| Hong Soo Hwa | $520,000 | First American Title Ins Co | |
| Highland Home Builders Inc | $162,000 | -- |
Source: Public Records
Mortgage History
| Date | Status | Borrower | Loan Amount |
|---|---|---|---|
| Open | Laskaris Ioannis | $625,000 | |
| Previous Owner | Hong Soo Hwa | $400,000 |
Source: Public Records
Tax History Compared to Growth
Tax History
| Year | Tax Paid | Tax Assessment Tax Assessment Total Assessment is a certain percentage of the fair market value that is determined by local assessors to be the total taxable value of land and additions on the property. | Land | Improvement |
|---|---|---|---|---|
| 2025 | $28,450 | $1,205 | $316 | $889 |
| 2024 | $6,657 | $1,205 | $316 | $889 |
| 2023 | $25,642 | $1,205 | $316 | $889 |
| 2022 | $25,642 | $1,205 | $316 | $889 |
| 2021 | $24,096 | $1,179 | $309 | $870 |
| 2020 | $22,335 | $1,343 | $641 | $702 |
| 2019 | $19,861 | $1,343 | $641 | $702 |
| 2018 | $18,960 | $1,343 | $0 | $0 |
| 2017 | $12,119 | $1,343 | $641 | $702 |
| 2016 | $16,418 | $1,343 | $609 | $734 |
| 2015 | $4,089 | $1,343 | $542 | $801 |
| 2014 | $4,089 | $1,343 | $542 | $801 |
| 2013 | $4,082 | $1,414 | $571 | $843 |
Source: Public Records
Map
Nearby Homes
- 5 Garfield Place
- 22 High St
- 53 Maple St
- 38 High St
- 69 Woodward St
- 31 Woodward St
- 37 Maple St
- 97 Burnham Ave
- 70 Short Way
- 142 Willow St
- 39 Oakdale Rd
- 65 Stratford N
- 134 Warner Ave
- 99 Warner Ave
- 107 Warner Ave
- 15 Dianas Cir
- 2 Edwards St Unit 3 B
- 16 Edwards St Unit 2G
- 11 Manor Ave
- 18 Edwards St Unit 2B
- 23 Garfield Place
- 11 Garfield Place
- 7 Garfield Place
- 108 Macgregor Ave
- 127 Powerhouse Rd
- 129 Powerhouse Rd
- 104 Macgregor Ave
- 104 Macgregor Ave Unit 2
- 104 Macgregor Ave Unit 2nd Fl
- 18 Garfield Place
- 14 Garfield Place
- 10 Garfield Place
- 98 Macgregor Ave
- 6 Garfield Place
- 137 Powerhouse Rd
- 137 Powerhouse Rd
- 137 Powerhouse Rd
- 137 Powerhouse Rd
- 137 Powerhouse Rd
- 137 Powerhouse Rd