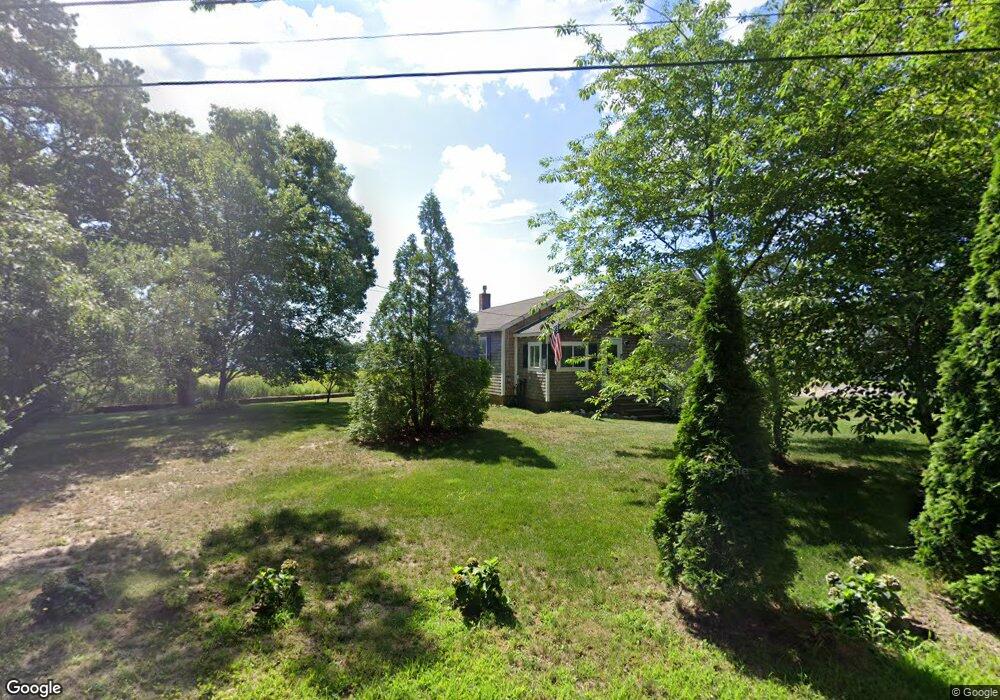
17 Gordon St West Wareham, MA 02576
Estimated Value: $531,000 - $559,000
2
Beds
2
Baths
1,360
Sq Ft
$400/Sq Ft
Est. Value
About This Home
This home is located at 17 Gordon St, West Wareham, MA 02576 and is currently estimated at $544,168, approximately $400 per square foot. 17 Gordon St is a home located in Plymouth County.
Ownership History
Date
Name
Owned For
Owner Type
Purchase Details
Closed on
Dec 1, 2022
Sold by
Bohn John J
Bought by
Carbone Christopher S and Carbone Robin M
Current Estimated Value
Purchase Details
Closed on
Oct 31, 2005
Sold by
Letendre Suzanne P
Bought by
Bohn John J
Home Financials for this Owner
Home Financials are based on the most recent Mortgage that was taken out on this home.
Original Mortgage
$303,200
Interest Rate
5.79%
Mortgage Type
Purchase Money Mortgage
Purchase Details
Closed on
May 10, 1996
Sold by
Duncan Elizabeth A
Bought by
Letendre Suzanne P
Create a Home Valuation Report for This Property
The Home Valuation Report is an in-depth analysis detailing your home's value as well as a comparison with similar homes in the area
Purchase History
| Date | Buyer | Sale Price | Title Company |
|---|---|---|---|
| Carbone Christopher S | $480,000 | None Available | |
| Carbone Christopher S | $480,000 | None Available | |
| Carbone Christopher S | $480,000 | None Available | |
| Bohn John J | $379,000 | -- | |
| Letendre Suzanne P | $86,000 | -- | |
| Bohn John J | $379,000 | -- | |
| Letendre Suzanne P | $86,000 | -- |
Source: Public Records
Mortgage History
| Date | Status | Borrower | Loan Amount |
|---|---|---|---|
| Previous Owner | Letendre Suzanne P | $303,200 | |
| Previous Owner | Letendre Suzanne P | $55,000 |
Source: Public Records
Tax History
| Year | Tax Paid | Tax Assessment Tax Assessment Total Assessment is a certain percentage of the fair market value that is determined by local assessors to be the total taxable value of land and additions on the property. | Land | Improvement |
|---|---|---|---|---|
| 2025 | $4,647 | $446,000 | $212,900 | $233,100 |
| 2024 | $4,403 | $392,100 | $169,300 | $222,800 |
| 2023 | $4,115 | $351,200 | $153,700 | $197,500 |
| 2022 | $4,115 | $312,200 | $153,700 | $158,500 |
| 2021 | $3,933 | $292,400 | $153,700 | $138,700 |
| 2020 | $3,787 | $285,600 | $153,700 | $131,900 |
| 2019 | $3,804 | $286,200 | $160,000 | $126,200 |
| 2018 | $3,675 | $269,600 | $160,000 | $109,600 |
| 2017 | $3,057 | $227,300 | $136,000 | $91,300 |
| 2016 | $2,931 | $216,600 | $136,000 | $80,600 |
| 2015 | $2,831 | $216,600 | $136,000 | $80,600 |
| 2014 | $2,580 | $200,800 | $121,000 | $79,800 |
Source: Public Records
Map
Nearby Homes
Your Personal Tour Guide
Ask me questions while you tour the home.