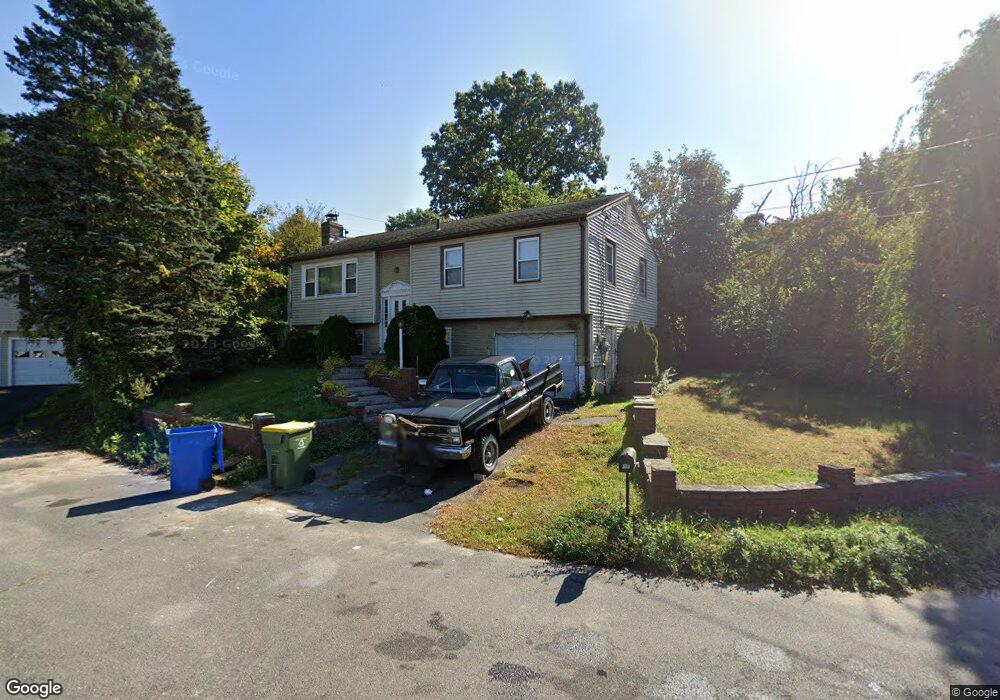
17 Gorman Cir Waterbury, CT 06706
South End District NeighborhoodEstimated Value: $260,000 - $325,000
3
Beds
2
Baths
960
Sq Ft
$309/Sq Ft
Est. Value
About This Home
This home is located at 17 Gorman Cir, Waterbury, CT 06706 and is currently estimated at $296,716, approximately $309 per square foot. 17 Gorman Cir is a home located in New Haven County with nearby schools including John G. Gilmartin Elementary School, John F. Kennedy High School, and Our Lady Of Mount Carmel School.
Ownership History
Date
Name
Owned For
Owner Type
Purchase Details
Closed on
Nov 25, 2013
Sold by
Ciardi Daniel and Ciardi Marisol J
Bought by
Department Of Housing & Urban Dev
Current Estimated Value
Purchase Details
Closed on
Sep 23, 2002
Sold by
Perez Leonides
Bought by
Ciardi Daniel
Home Financials for this Owner
Home Financials are based on the most recent Mortgage that was taken out on this home.
Original Mortgage
$113,121
Interest Rate
6.36%
Mortgage Type
Purchase Money Mortgage
Purchase Details
Closed on
Feb 8, 2000
Sold by
Ramadani Shaziman
Bought by
Dejesus Milton and Perez Leonides
Purchase Details
Closed on
Sep 3, 1997
Sold by
Commercial Credit Corp
Bought by
Ramadani Shaziman
Purchase Details
Closed on
Oct 22, 1992
Sold by
Commercial Credit
Bought by
Bisaillon Elizabeth and Bisaillon Daniel
Create a Home Valuation Report for This Property
The Home Valuation Report is an in-depth analysis detailing your home's value as well as a comparison with similar homes in the area
Home Values in the Area
Average Home Value in this Area
Purchase History
| Date | Buyer | Sale Price | Title Company |
|---|---|---|---|
| Department Of Housing & Urban Dev | -- | -- | |
| Ciardi Daniel | $114,900 | -- | |
| Dejesus Milton | $91,000 | -- | |
| Ramadani Shaziman | $57,000 | -- | |
| Bisaillon Elizabeth | $104,000 | -- |
Source: Public Records
Mortgage History
| Date | Status | Borrower | Loan Amount |
|---|---|---|---|
| Previous Owner | Bisaillon Elizabeth | $57,000 | |
| Previous Owner | Bisaillon Elizabeth | $28,000 | |
| Previous Owner | Bisaillon Elizabeth | $113,121 |
Source: Public Records
Tax History Compared to Growth
Tax History
| Year | Tax Paid | Tax Assessment Tax Assessment Total Assessment is a certain percentage of the fair market value that is determined by local assessors to be the total taxable value of land and additions on the property. | Land | Improvement |
|---|---|---|---|---|
| 2025 | $5,123 | $113,890 | $17,290 | $96,600 |
| 2024 | $5,631 | $113,890 | $17,290 | $96,600 |
| 2023 | $6,172 | $113,890 | $17,290 | $96,600 |
| 2022 | $4,226 | $70,190 | $17,290 | $52,900 |
| 2021 | $4,226 | $70,190 | $17,290 | $52,900 |
| 2020 | $4,226 | $70,190 | $17,290 | $52,900 |
| 2019 | $4,226 | $70,190 | $17,290 | $52,900 |
| 2018 | $4,226 | $70,190 | $17,290 | $52,900 |
| 2017 | $4,265 | $70,840 | $17,290 | $53,550 |
| 2016 | $4,265 | $70,840 | $17,290 | $53,550 |
| 2015 | $4,124 | $70,840 | $17,290 | $53,550 |
| 2014 | $4,124 | $70,840 | $17,290 | $53,550 |
Source: Public Records
Map
Nearby Homes
- 212 Pearl Lake Rd
- 35 Pearl Lake Rd Unit B
- 73 Cornelius Ave
- 171 Kelsey St
- 16 Highview St
- 1385 Highland Ave Unit 20A
- 236 Union City Rd
- 1159 Highland Ave Unit 35A
- 1159 Highland Ave Unit 28B
- 463 Pearl Lake Rd
- 34 Katie Ln
- 92 Welland Ave
- 207 Nichols Dr
- 29 Ramsey Ave
- 00 Milton Ave
- 6 Peach St
- 562 Piedmont St
- 335 Raymond St
- 35 Monahan Ln
- 48 Macnamara St