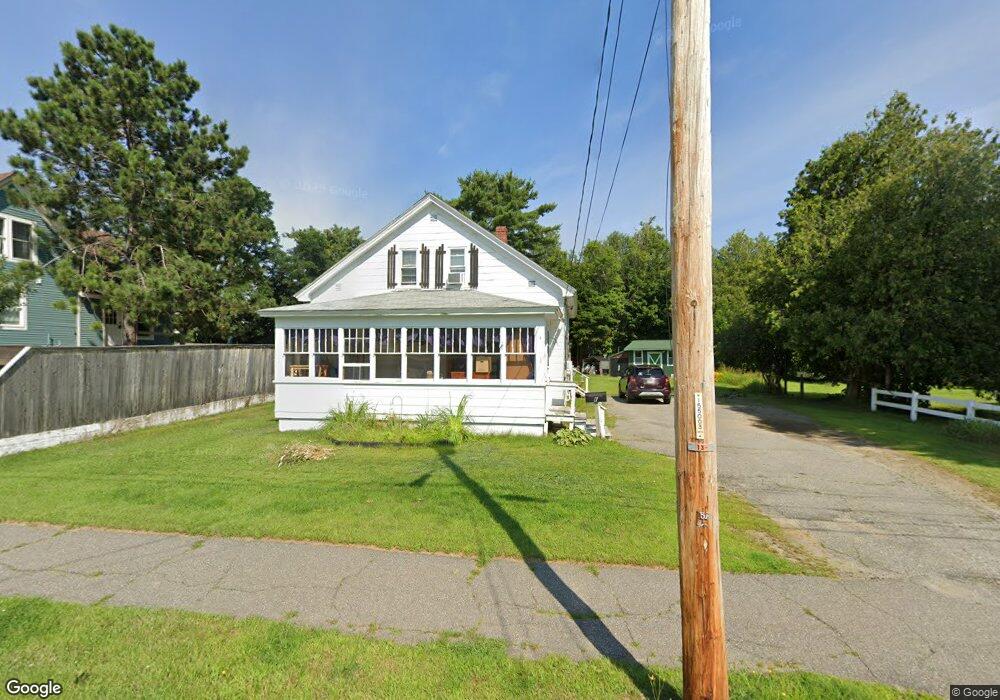
17 Granite St Millinocket, ME 04462
Estimated Value: $130,806 - $152,000
3
Beds
1
Bath
1,325
Sq Ft
$109/Sq Ft
Est. Value
About This Home
This home is located at 17 Granite St, Millinocket, ME 04462 and is currently estimated at $144,452, approximately $109 per square foot. 17 Granite St is a home located in Penobscot County with nearby schools including Granite Street School and Stearns Junior/Senior High School.
Ownership History
Date
Name
Owned For
Owner Type
Purchase Details
Closed on
Oct 17, 2023
Sold by
Wilson Melissa S and Blackmore Toni M
Bought by
Wilson Susan
Current Estimated Value
Home Financials for this Owner
Home Financials are based on the most recent Mortgage that was taken out on this home.
Original Mortgage
$63,715
Outstanding Balance
$62,345
Interest Rate
7.12%
Mortgage Type
FHA
Estimated Equity
$82,107
Purchase Details
Closed on
Aug 10, 2023
Sold by
Wilson Sr Terrance Est and Wilson
Bought by
Wilson Terrance F and Wilson Melissa S
Purchase Details
Closed on
Oct 18, 2016
Sold by
Tibbitts Elizabeth J E and Tibbitts Tibbetts
Bought by
Wilson Terrance
Home Financials for this Owner
Home Financials are based on the most recent Mortgage that was taken out on this home.
Original Mortgage
$27,200
Interest Rate
3.46%
Mortgage Type
Commercial
Create a Home Valuation Report for This Property
The Home Valuation Report is an in-depth analysis detailing your home's value as well as a comparison with similar homes in the area
Home Values in the Area
Average Home Value in this Area
Purchase History
| Date | Buyer | Sale Price | Title Company |
|---|---|---|---|
| Wilson Susan | $100,000 | None Available | |
| Wilson Terrance F | -- | None Available | |
| Wilson Terrance | -- | -- |
Source: Public Records
Mortgage History
| Date | Status | Borrower | Loan Amount |
|---|---|---|---|
| Open | Wilson Susan | $63,715 | |
| Previous Owner | Wilson Terrance | $27,200 |
Source: Public Records
Tax History
| Year | Tax Paid | Tax Assessment Tax Assessment Total Assessment is a certain percentage of the fair market value that is determined by local assessors to be the total taxable value of land and additions on the property. | Land | Improvement |
|---|---|---|---|---|
| 2025 | $1,773 | $77,100 | $12,400 | $64,700 |
| 2024 | $1,717 | $62,200 | $6,400 | $55,800 |
| 2023 | $1,438 | $51,000 | $6,400 | $44,600 |
| 2022 | $1,354 | $45,900 | $6,400 | $39,500 |
| 2021 | $1,375 | $42,300 | $6,400 | $35,900 |
| 2020 | $1,370 | $40,300 | $6,400 | $33,900 |
| 2019 | $1,330 | $40,300 | $6,400 | $33,900 |
| 2018 | $1,310 | $40,300 | $6,400 | $33,900 |
| 2017 | $1,302 | $40,300 | $6,400 | $33,900 |
| 2016 | $748 | $40,300 | $6,400 | $33,900 |
| 2015 | $1,195 | $40,300 | $6,400 | $33,900 |
| 2014 | $1,193 | $40,300 | $6,400 | $33,900 |
Source: Public Records
Map
Nearby Homes
Your Personal Tour Guide
Ask me questions while you tour the home.