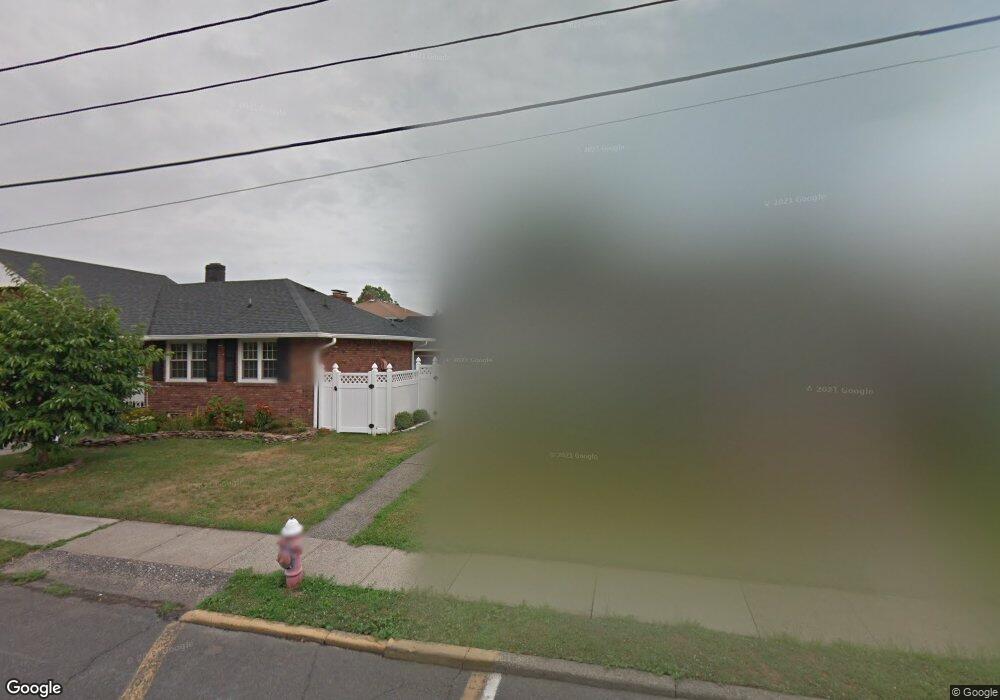
17 Grant St Unit 19 East Rutherford, NJ 07073
Estimated Value: $691,000 - $817,000
--
Bed
--
Bath
2,358
Sq Ft
$321/Sq Ft
Est. Value
About This Home
This home is located at 17 Grant St Unit 19, East Rutherford, NJ 07073 and is currently estimated at $757,714, approximately $321 per square foot. 17 Grant St Unit 19 is a home located in Bergen County with nearby schools including Mckenzie School, Alfred Faust School, and Henry P Becton Regional High School.
Ownership History
Date
Name
Owned For
Owner Type
Purchase Details
Closed on
Jan 3, 2000
Sold by
Smith Randall
Bought by
Giovatto John
Current Estimated Value
Purchase Details
Closed on
Sep 1, 1998
Sold by
Helstoski Margaret
Bought by
Strauss Tracy Allen and Strauss Gayle Susan
Home Financials for this Owner
Home Financials are based on the most recent Mortgage that was taken out on this home.
Original Mortgage
$184,000
Interest Rate
6.8%
Create a Home Valuation Report for This Property
The Home Valuation Report is an in-depth analysis detailing your home's value as well as a comparison with similar homes in the area
Home Values in the Area
Average Home Value in this Area
Purchase History
| Date | Buyer | Sale Price | Title Company |
|---|---|---|---|
| Giovatto John | -- | -- | |
| Strauss Tracy Allen | -- | -- |
Source: Public Records
Mortgage History
| Date | Status | Borrower | Loan Amount |
|---|---|---|---|
| Previous Owner | Strauss Tracy Allen | $184,000 |
Source: Public Records
Tax History Compared to Growth
Tax History
| Year | Tax Paid | Tax Assessment Tax Assessment Total Assessment is a certain percentage of the fair market value that is determined by local assessors to be the total taxable value of land and additions on the property. | Land | Improvement |
|---|---|---|---|---|
| 2025 | $9,363 | $615,800 | $321,600 | $294,200 |
| 2024 | $9,034 | $577,600 | $309,400 | $268,200 |
| 2023 | $9,170 | $556,600 | $297,300 | $259,300 |
| 2022 | $9,170 | $523,700 | $275,500 | $248,200 |
| 2021 | $8,814 | $490,500 | $251,200 | $239,300 |
| 2020 | $8,629 | $474,400 | $246,400 | $228,000 |
| 2019 | $8,847 | $482,900 | $244,000 | $238,900 |
| 2018 | $7,608 | $427,900 | $210,700 | $217,200 |
| 2017 | $9,049 | $436,300 | $194,000 | $242,300 |
| 2016 | $8,486 | $436,300 | $194,000 | $242,300 |
| 2015 | $8,582 | $436,300 | $194,000 | $242,300 |
| 2014 | $8,307 | $436,300 | $194,000 | $242,300 |
Source: Public Records
Map
Nearby Homes
- 36 Pulaski Ave
- 792 Morton St
- 905 River Renaissance
- 17 Bond St
- 416 River Renaissance Unit A16
- 416 River Renaissance
- 295 Carlton Ave
- 159 Anderson Ave
- 11 Roehrs Dr
- 33 Bobbink Terrace
- 115 Wallington Ave
- 113 Wallington Ave
- 106-110 Hayward Place
- 92 Maple Ave
- 38B Triumph Ct
- 83 Anderson Ave
- 62 Johnson Ave
- 47 Vanderburgh Ave
- 72 Hayward Place
- 415 Washington Ave