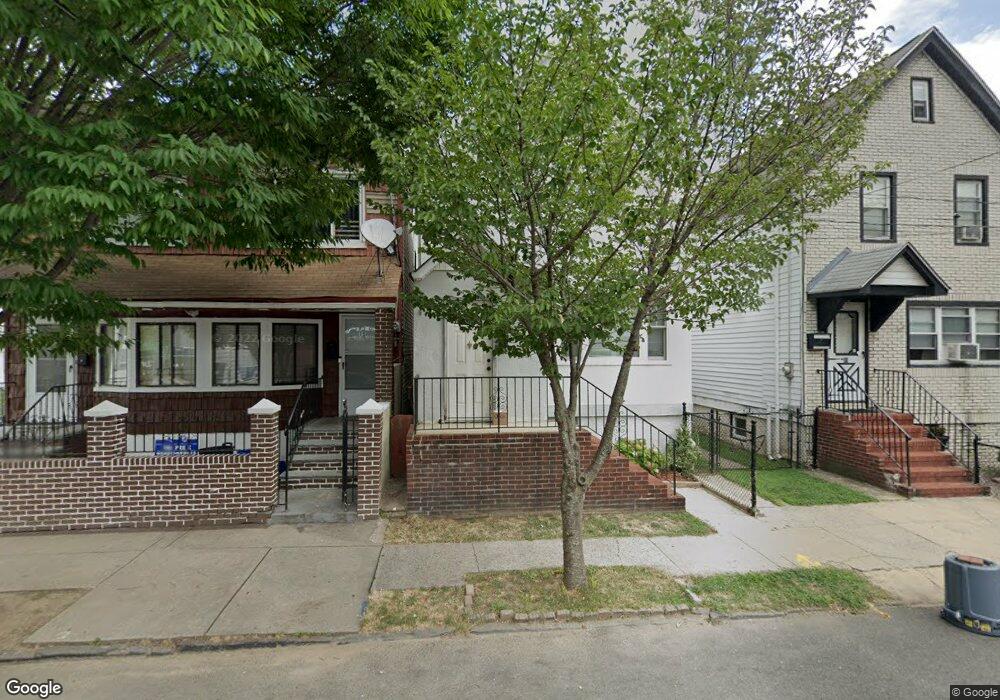
17 Gray St Staten Island, NY 10304
Stapleton NeighborhoodEstimated Value: $401,000 - $475,000
--
Bed
4
Baths
918
Sq Ft
$477/Sq Ft
Est. Value
About This Home
This home is located at 17 Gray St, Staten Island, NY 10304 and is currently estimated at $437,976, approximately $477 per square foot. 17 Gray St is a home located in Richmond County with nearby schools including P.S. 78, P.S./I.S. 78Q Early Childhood Center, and I.S. 49 Berta A Dreyfus.
Ownership History
Date
Name
Owned For
Owner Type
Purchase Details
Closed on
Oct 26, 2018
Sold by
Granberg George V and Estate Of Adolph G Granberg
Bought by
Granberg Gary
Current Estimated Value
Home Financials for this Owner
Home Financials are based on the most recent Mortgage that was taken out on this home.
Original Mortgage
$188,000
Outstanding Balance
$164,970
Interest Rate
4.7%
Mortgage Type
New Conventional
Estimated Equity
$273,006
Create a Home Valuation Report for This Property
The Home Valuation Report is an in-depth analysis detailing your home's value as well as a comparison with similar homes in the area
Home Values in the Area
Average Home Value in this Area
Purchase History
| Date | Buyer | Sale Price | Title Company |
|---|---|---|---|
| Granberg Gary | $235,000 | Old Republic National Title |
Source: Public Records
Mortgage History
| Date | Status | Borrower | Loan Amount |
|---|---|---|---|
| Open | Granberg Gary | $188,000 |
Source: Public Records
Tax History Compared to Growth
Tax History
| Year | Tax Paid | Tax Assessment Tax Assessment Total Assessment is a certain percentage of the fair market value that is determined by local assessors to be the total taxable value of land and additions on the property. | Land | Improvement |
|---|---|---|---|---|
| 2025 | $3,037 | $25,500 | $3,432 | $22,068 |
| 2024 | $3,037 | $21,720 | $3,801 | $17,919 |
| 2023 | $2,910 | $14,328 | $3,235 | $11,093 |
| 2022 | $2,860 | $21,960 | $5,460 | $16,500 |
| 2021 | $2,979 | $21,660 | $5,460 | $16,200 |
| 2020 | $2,827 | $18,660 | $5,460 | $13,200 |
| 2019 | $2,636 | $16,800 | $5,460 | $11,340 |
| 2018 | $2,434 | $11,940 | $5,460 | $6,480 |
| 2017 | $2,549 | $12,504 | $4,991 | $7,513 |
| 2016 | $2,358 | $11,797 | $4,814 | $6,983 |
| 2015 | $2,015 | $11,130 | $4,208 | $6,922 |
| 2014 | $2,015 | $10,500 | $4,560 | $5,940 |
Source: Public Records
Map
Nearby Homes