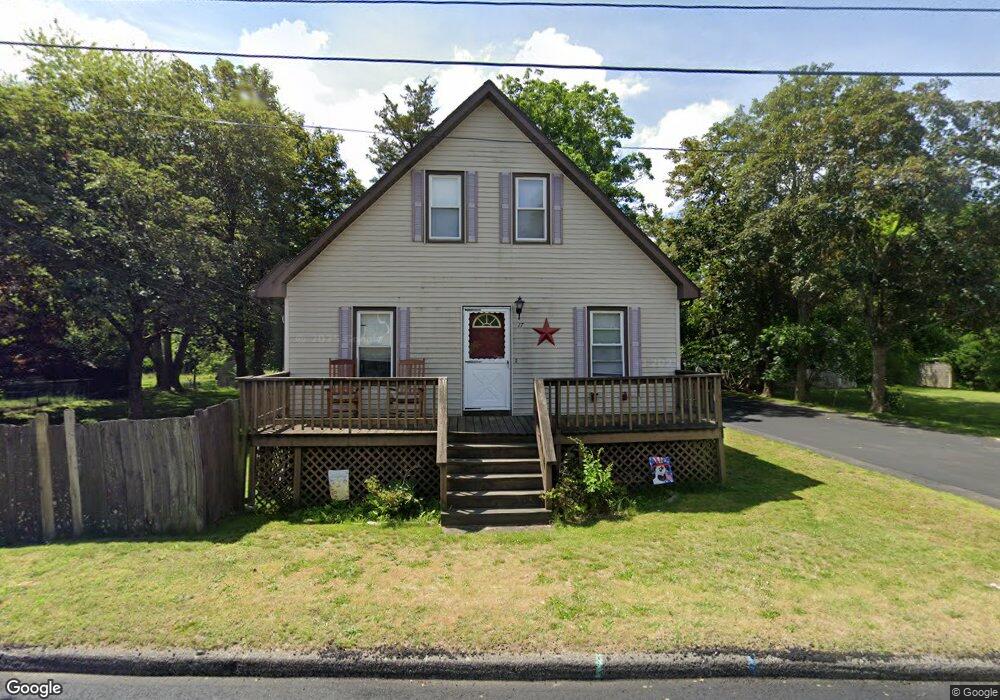
17 Harding Rd Fairhaven, MA 02719
North Fairhaven NeighborhoodEstimated Value: $432,324 - $466,000
3
Beds
1
Bath
1,287
Sq Ft
$349/Sq Ft
Est. Value
About This Home
This home is located at 17 Harding Rd, Fairhaven, MA 02719 and is currently estimated at $449,081, approximately $348 per square foot. 17 Harding Rd is a home located in Bristol County with nearby schools including Fairhaven High School, Alma Del Mar Charter School, and St. Joseph School.
Ownership History
Date
Name
Owned For
Owner Type
Purchase Details
Closed on
Dec 5, 2023
Sold by
Arsenault Dennis A and Arsenault Karen M
Bought by
Harding Rd Rt and Mathieu
Current Estimated Value
Create a Home Valuation Report for This Property
The Home Valuation Report is an in-depth analysis detailing your home's value as well as a comparison with similar homes in the area
Home Values in the Area
Average Home Value in this Area
Purchase History
| Date | Buyer | Sale Price | Title Company |
|---|---|---|---|
| Harding Rd Rt | -- | None Available |
Source: Public Records
Tax History Compared to Growth
Tax History
| Year | Tax Paid | Tax Assessment Tax Assessment Total Assessment is a certain percentage of the fair market value that is determined by local assessors to be the total taxable value of land and additions on the property. | Land | Improvement |
|---|---|---|---|---|
| 2025 | $32 | $347,200 | $174,100 | $173,100 |
| 2024 | $3,120 | $338,000 | $174,100 | $163,900 |
| 2023 | $3,044 | $305,900 | $152,500 | $153,400 |
| 2022 | $2,948 | $288,500 | $141,700 | $146,800 |
| 2021 | $8,343 | $248,300 | $128,200 | $120,100 |
| 2020 | $2,746 | $248,300 | $128,200 | $120,100 |
| 2019 | $7,553 | $216,600 | $106,400 | $110,200 |
| 2018 | $2,440 | $206,400 | $101,200 | $105,200 |
| 2017 | $7,420 | $199,000 | $101,200 | $97,800 |
| 2016 | $2,318 | $190,300 | $101,200 | $89,100 |
| 2015 | $2,293 | $188,700 | $101,200 | $87,500 |
Source: Public Records
Map
Nearby Homes