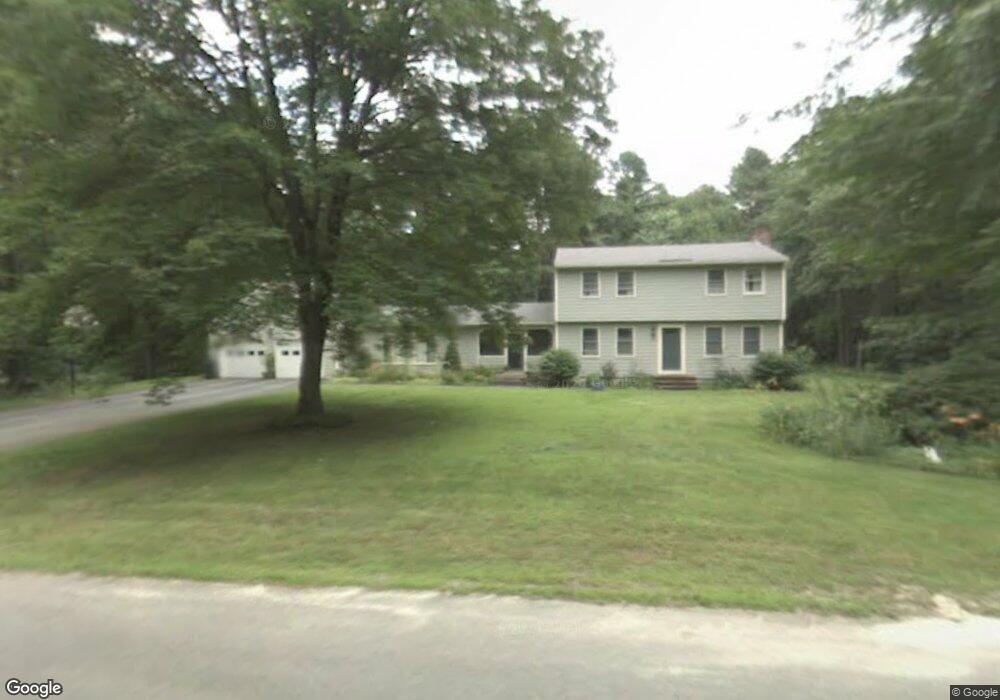
17 Hemlock Rd Brunswick, ME 04011
Estimated Value: $689,939 - $899,000
4
Beds
3
Baths
2,846
Sq Ft
$279/Sq Ft
Est. Value
About This Home
This home is located at 17 Hemlock Rd, Brunswick, ME 04011 and is currently estimated at $794,985, approximately $279 per square foot. 17 Hemlock Rd is a home located in Cumberland County with nearby schools including Kate Furbish Elementary School, Brunswick Jr High School, and Brunswick High School.
Ownership History
Date
Name
Owned For
Owner Type
Purchase Details
Closed on
Nov 2, 2007
Sold by
Sfirri Michael J
Bought by
Levine Peter C and Levine Emily B
Current Estimated Value
Home Financials for this Owner
Home Financials are based on the most recent Mortgage that was taken out on this home.
Original Mortgage
$202,500
Interest Rate
6.43%
Mortgage Type
Unknown
Create a Home Valuation Report for This Property
The Home Valuation Report is an in-depth analysis detailing your home's value as well as a comparison with similar homes in the area
Home Values in the Area
Average Home Value in this Area
Purchase History
| Date | Buyer | Sale Price | Title Company |
|---|---|---|---|
| Levine Peter C | -- | -- |
Source: Public Records
Mortgage History
| Date | Status | Borrower | Loan Amount |
|---|---|---|---|
| Open | Levine Peter C | $202,000 | |
| Closed | Levine Peter C | $202,500 | |
| Closed | Levine Peter C | $104,000 | |
| Previous Owner | Levine Peter C | $110,000 |
Source: Public Records
Tax History
| Year | Tax Paid | Tax Assessment Tax Assessment Total Assessment is a certain percentage of the fair market value that is determined by local assessors to be the total taxable value of land and additions on the property. | Land | Improvement |
|---|---|---|---|---|
| 2024 | $8,421 | $353,100 | $96,900 | $256,200 |
| 2023 | $8,147 | $349,800 | $96,900 | $252,900 |
| 2022 | $7,583 | $349,600 | $96,900 | $252,700 |
| 2021 | $7,293 | $349,600 | $96,900 | $252,700 |
| 2020 | $7,121 | $349,600 | $96,900 | $252,700 |
| 2019 | $6,894 | $349,600 | $96,900 | $252,700 |
| 2018 | $6,614 | $349,600 | $96,900 | $252,700 |
| 2017 | $6,422 | $349,600 | $96,900 | $252,700 |
| 2016 | $6,237 | $212,500 | $70,800 | $141,700 |
| 2015 | $6,027 | $212,500 | $70,800 | $141,700 |
| 2014 | $5,823 | $212,500 | $70,800 | $141,700 |
| 2013 | -- | $212,500 | $70,800 | $141,700 |
Source: Public Records
Map
Nearby Homes
- 4 Iris Way Unit 50
- Lot 8 Village Cir
- 9 Village Cir
- 23 Village Cir
- 20 Village Cir
- 32 Village Cir
- Lot 16 Village Cir
- Lot 14 Village Cir
- Lot 15 Village Cir
- 60 County Crossing
- 6 Chebeague Ln
- 250 Mere Point Rd
- 7 Krampf Cir
- 5 Krampf Cir
- 23 Noble St
- 20 Shobe Ave
- Lot 196 Mckeen St Unit 16
- Lot 196 Mckeen St Unit 17
- Lot 196 Mckeen St Unit 21
- 35 & 35.5 Bath Rd
Your Personal Tour Guide
Ask me questions while you tour the home.