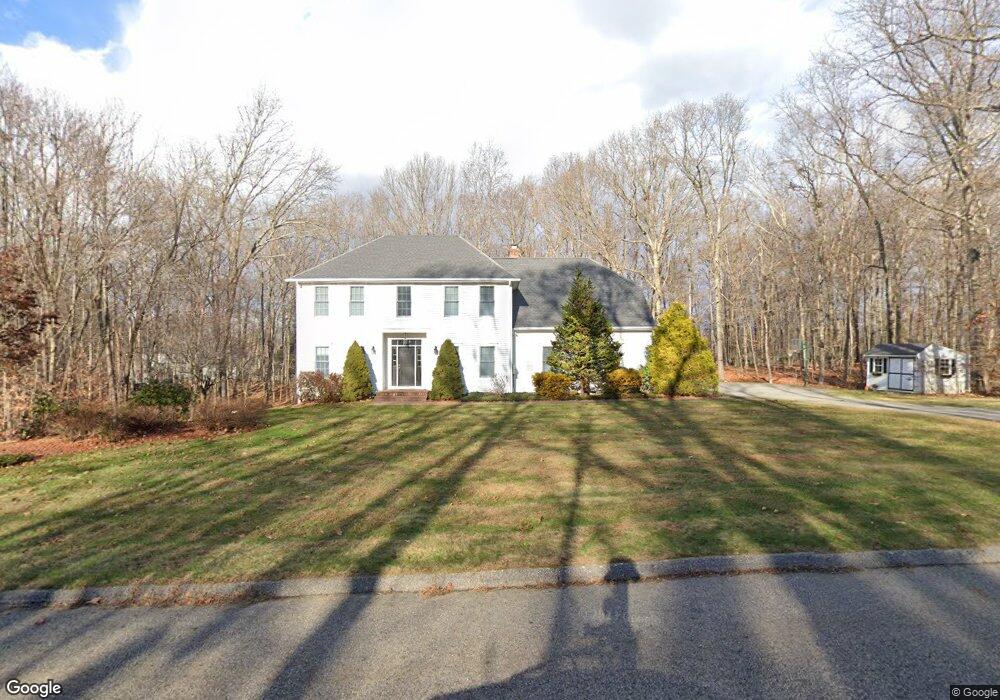
17 Heritage Rd Columbia, CT 06237
Estimated Value: $563,000 - $773,000
3
Beds
3
Baths
3,419
Sq Ft
$196/Sq Ft
Est. Value
About This Home
This home is located at 17 Heritage Rd, Columbia, CT 06237 and is currently estimated at $669,063, approximately $195 per square foot. 17 Heritage Rd is a home located in Tolland County with nearby schools including Horace W. Porter School.
Ownership History
Date
Name
Owned For
Owner Type
Purchase Details
Closed on
Aug 17, 2020
Sold by
Bass Susan R
Bought by
Susan Robin Bass Lt
Current Estimated Value
Purchase Details
Closed on
Nov 2, 1999
Sold by
Pheasant Run Dev
Bought by
Kaufman Jonathan and Kaufman Susan
Home Financials for this Owner
Home Financials are based on the most recent Mortgage that was taken out on this home.
Original Mortgage
$300,000
Interest Rate
7.78%
Purchase Details
Closed on
Jul 13, 1995
Sold by
Heritage Assoc
Bought by
Pheasant Run Dev
Create a Home Valuation Report for This Property
The Home Valuation Report is an in-depth analysis detailing your home's value as well as a comparison with similar homes in the area
Home Values in the Area
Average Home Value in this Area
Purchase History
| Date | Buyer | Sale Price | Title Company |
|---|---|---|---|
| Susan Robin Bass Lt | -- | None Available | |
| Kaufman Jonathan | $58,000 | -- | |
| Pheasant Run Dev | $45,500 | -- |
Source: Public Records
Mortgage History
| Date | Status | Borrower | Loan Amount |
|---|---|---|---|
| Previous Owner | Pheasant Run Dev | $100,911 | |
| Previous Owner | Pheasant Run Dev | $300,000 |
Source: Public Records
Tax History Compared to Growth
Tax History
| Year | Tax Paid | Tax Assessment Tax Assessment Total Assessment is a certain percentage of the fair market value that is determined by local assessors to be the total taxable value of land and additions on the property. | Land | Improvement |
|---|---|---|---|---|
| 2025 | $9,466 | $323,400 | $50,120 | $273,280 |
| 2024 | $9,094 | $323,400 | $50,120 | $273,280 |
| 2023 | $8,093 | $312,340 | $50,120 | $262,220 |
| 2022 | $8,080 | $312,340 | $50,120 | $262,220 |
| 2021 | $7,403 | $252,400 | $50,300 | $202,100 |
| 2020 | $7,403 | $252,400 | $50,300 | $202,100 |
| 2019 | $7,403 | $252,400 | $50,300 | $202,100 |
| 2018 | $7,403 | $252,400 | $50,300 | $202,100 |
| 2017 | $7,289 | $252,400 | $50,300 | $202,100 |
| 2016 | $6,912 | $251,900 | $50,300 | $201,600 |
| 2015 | $6,834 | $251,900 | $50,300 | $201,600 |
| 2014 | $6,834 | $251,900 | $50,300 | $201,600 |
Source: Public Records
Map
Nearby Homes