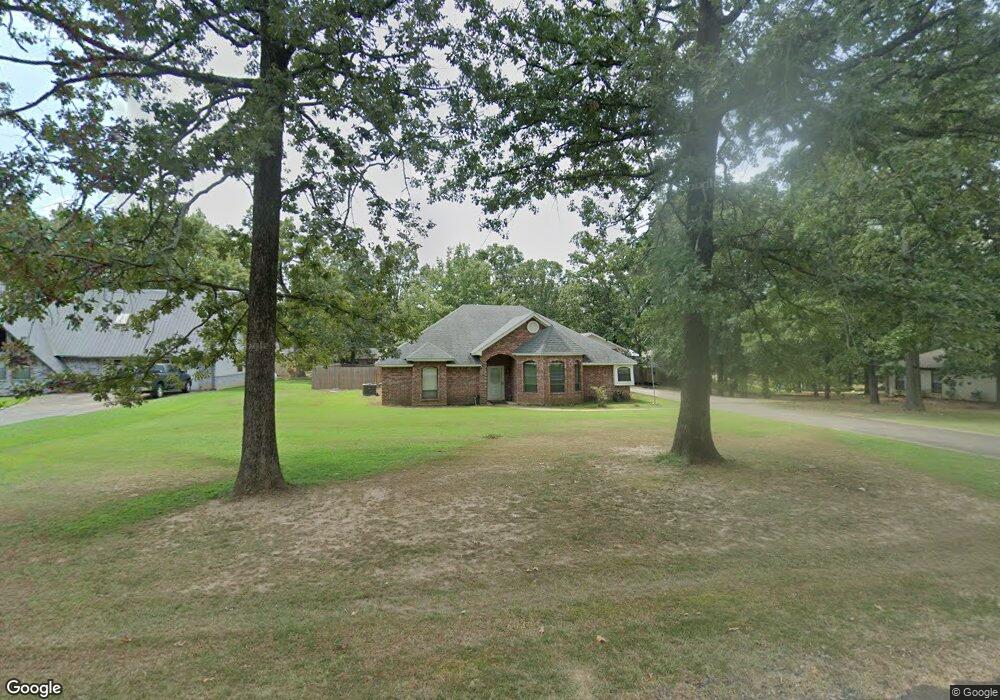
17 Hickory Oak Ln Texarkana, TX 75501
Estimated Value: $258,863 - $315,000
--
Bed
--
Bath
1,758
Sq Ft
$167/Sq Ft
Est. Value
About This Home
This home is located at 17 Hickory Oak Ln, Texarkana, TX 75501 and is currently estimated at $293,716, approximately $167 per square foot. 17 Hickory Oak Ln is a home located in Bowie County with nearby schools including Redwater Elementary School, Redwater Middle School, and Redwater Junior High School.
Ownership History
Date
Name
Owned For
Owner Type
Purchase Details
Closed on
Oct 15, 2015
Sold by
Balmain Adam C and Balmain Heather M
Bought by
Stroman Douglas A and Stroman Brenda R
Current Estimated Value
Home Financials for this Owner
Home Financials are based on the most recent Mortgage that was taken out on this home.
Original Mortgage
$161,477
Outstanding Balance
$127,005
Interest Rate
3.87%
Mortgage Type
FHA
Estimated Equity
$166,711
Purchase Details
Closed on
Dec 13, 2013
Sold by
Phares Billy Joe and Phares Sondra Davis
Bought by
Balmain Adam C and Balmain Heather M
Home Financials for this Owner
Home Financials are based on the most recent Mortgage that was taken out on this home.
Original Mortgage
$156,187
Interest Rate
4.21%
Mortgage Type
VA
Create a Home Valuation Report for This Property
The Home Valuation Report is an in-depth analysis detailing your home's value as well as a comparison with similar homes in the area
Home Values in the Area
Average Home Value in this Area
Purchase History
| Date | Buyer | Sale Price | Title Company |
|---|---|---|---|
| Stroman Douglas A | -- | Stewart Title | |
| Balmain Adam C | -- | None Available |
Source: Public Records
Mortgage History
| Date | Status | Borrower | Loan Amount |
|---|---|---|---|
| Open | Stroman Douglas A | $161,477 | |
| Previous Owner | Balmain Adam C | $156,187 |
Source: Public Records
Tax History Compared to Growth
Tax History
| Year | Tax Paid | Tax Assessment Tax Assessment Total Assessment is a certain percentage of the fair market value that is determined by local assessors to be the total taxable value of land and additions on the property. | Land | Improvement |
|---|---|---|---|---|
| 2025 | $668 | $281,723 | -- | -- |
| 2024 | $668 | $256,112 | $15,500 | $272,359 |
| 2023 | $3,416 | $232,829 | $0 | $0 |
| 2022 | $3,570 | $246,451 | $15,500 | $230,951 |
| 2021 | $3,425 | $204,564 | $15,500 | $189,064 |
| 2020 | $3,182 | $195,856 | $15,500 | $180,356 |
| 2019 | $3,055 | $159,025 | $15,500 | $143,525 |
| 2018 | $2,957 | $153,918 | $15,500 | $138,418 |
| 2017 | $2,782 | $151,424 | $15,500 | $135,924 |
| 2016 | $2,773 | $150,924 | $15,000 | $135,924 |
| 2015 | $2,727 | $149,695 | $15,000 | $134,695 |
| 2014 | $2,727 | $144,933 | $15,000 | $129,933 |
Source: Public Records
Map
Nearby Homes
- 6 Timberlake Dr
- 0 Tbd1 Shavers
- 442 County Road 1215 W
- 155 Lillian Ln
- 0 County Road 1214 Unit 109494
- 4157 Trexler Rd
- 342 Pierce Rd
- 5309 Trexler Rd
- 5315 Trexler Rd
- 12 Oak Haven Dr
- 224 Goodson Road Cr 1236
- 2720 Shady Pines Rd
- 49 Timberlane St
- 129 Pine St
- TBD U S Highway 67
- 105 Oak St
- 301 Cotton Ford Rd
- 0 W Lake Rd
- 33 Timber Ln
- 24 Heritage Blvd
- 19 Hickory Oak Ln
- 15 Hickory Oak Ln
- Lot 10 Hickory Oak Ln
- Lot 8 Hickory Oak Ln
- 0 Timberlake Dr
- 7 Timberlake Dr
- 16 Hickory Oak Ln
- 22 Hickory Oak Ln
- 14 Hickory Oak Ln
- 23 Hickory Oak Ln
- 11 Hickory Oak Ln
- 12 Hickory Oak Ln
- 24 Hickory Oak Ln
- 31 Hickory Oak Ln
- 25 Hickory Oak Ln
- 9 Hickory Oak Ln
- 14 Timberlake Dr
- 26 Hickory Oak Ln
- 171 Shady Ridge
- 171 Sandy Ridge