Estimated Value: $391,000 - $442,000
4
Beds
1
Bath
2,324
Sq Ft
$176/Sq Ft
Est. Value
About This Home
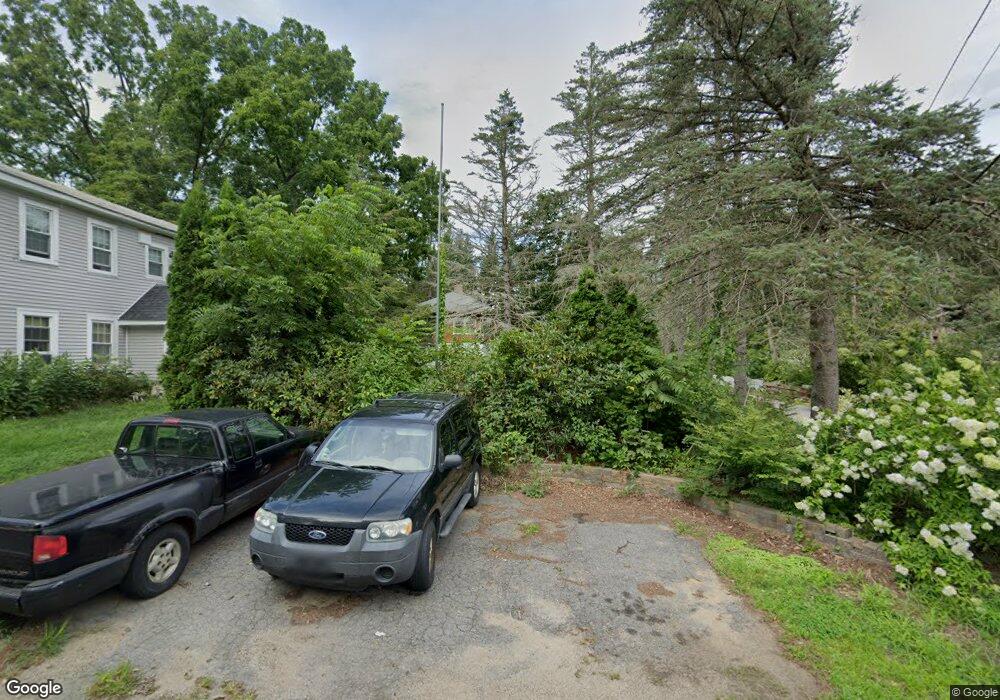
This home is located at 17 High St N, Barre, MA 01005 and is currently estimated at $409,080, approximately $176 per square foot. 17 High St N is a home located in Worcester County with nearby schools including Quabbin Regional Middle School and Quabbin Regional High School.
Ownership History
Date
Name
Owned For
Owner Type
Purchase Details
Closed on
Nov 26, 2002
Sold by
Mcqueston David W
Bought by
Rowlett James K and Platt Donna M
Current Estimated Value
Home Financials for this Owner
Home Financials are based on the most recent Mortgage that was taken out on this home.
Original Mortgage
$176,000
Outstanding Balance
$74,675
Interest Rate
6.07%
Mortgage Type
Purchase Money Mortgage
Estimated Equity
$334,405
Create a Home Valuation Report for This Property
The Home Valuation Report is an in-depth analysis detailing your home's value as well as a comparison with similar homes in the area
Home Values in the Area
Average Home Value in this Area
Purchase History
| Date | Buyer | Sale Price | Title Company |
|---|---|---|---|
| Rowlett James K | $220,000 | -- | |
| Rowlett James K | $220,000 | -- |
Source: Public Records
Mortgage History
| Date | Status | Borrower | Loan Amount |
|---|---|---|---|
| Open | Rowlett James K | $176,000 | |
| Closed | Rowlett James K | $176,000 |
Source: Public Records
Tax History
| Year | Tax Paid | Tax Assessment Tax Assessment Total Assessment is a certain percentage of the fair market value that is determined by local assessors to be the total taxable value of land and additions on the property. | Land | Improvement |
|---|---|---|---|---|
| 2025 | $5,053 | $371,800 | $50,300 | $321,500 |
| 2024 | $5,016 | $358,800 | $47,900 | $310,900 |
| 2023 | $4,488 | $283,000 | $37,300 | $245,700 |
| 2022 | $4,461 | $264,900 | $31,900 | $233,000 |
| 2021 | $4,066 | $225,900 | $31,900 | $194,000 |
| 2020 | $3,901 | $218,300 | $31,900 | $186,400 |
| 2019 | $3,722 | $205,400 | $29,000 | $176,400 |
| 2018 | $3,651 | $194,200 | $29,000 | $165,200 |
| 2017 | $3,560 | $190,400 | $29,000 | $161,400 |
| 2016 | $3,311 | $186,000 | $26,400 | $159,600 |
| 2015 | $3,357 | $180,100 | $33,600 | $146,500 |
| 2014 | $2,873 | $178,900 | $41,700 | $137,200 |
Source: Public Records
Map
Nearby Homes
- 144 Pleasant St
- 144 Pleasant St Unit 5
- 17-19 High St S
- 130 Pleasant St
- 28 High St N
- 18 High St N
- 32 High St N
- 126 Pleasant St
- 37 High St N
- 166 Pleasant St
- EA337 High St N
- 120 Pleasant St
- 135 Pleasant St
- 44 High St N
- 149 Pleasant St
- 123 Pleasant St
- 110 Pleasant St
- 45 High St N
- 32 Union St
- 186 Pleasant St
Your Personal Tour Guide
Ask me questions while you tour the home.