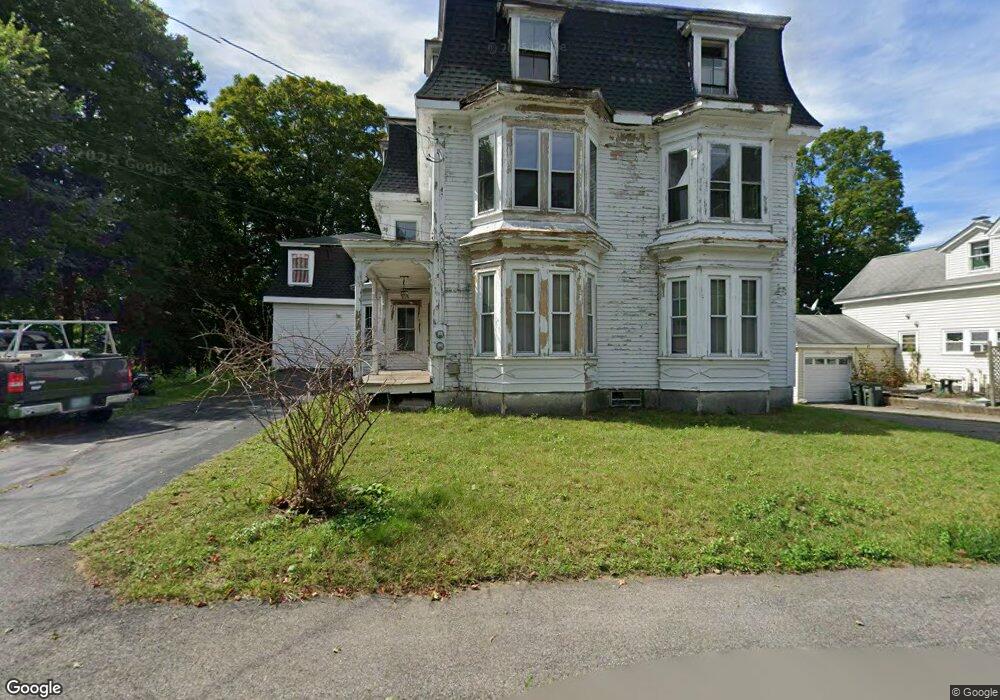
17 High St Unit 19 Pepperell, MA 01463
Estimated Value: $285,869 - $667,000
6
Beds
3
Baths
3,506
Sq Ft
$143/Sq Ft
Est. Value
About This Home
This home is located at 17 High St Unit 19, Pepperell, MA 01463 and is currently estimated at $502,467, approximately $143 per square foot. 17 High St Unit 19 is a home located in Middlesex County with nearby schools including North Middlesex Regional High School, Pepperell Christian Academy, and Maple Dene & Moppet School.
Ownership History
Date
Name
Owned For
Owner Type
Purchase Details
Closed on
Dec 1, 2022
Sold by
Hardy Robert R Sr Est
Bought by
Araujo Weverson D and Araujo Laudiceia G
Current Estimated Value
Purchase Details
Closed on
Feb 6, 1963
Bought by
Hardy Robert R
Create a Home Valuation Report for This Property
The Home Valuation Report is an in-depth analysis detailing your home's value as well as a comparison with similar homes in the area
Home Values in the Area
Average Home Value in this Area
Purchase History
| Date | Buyer | Sale Price | Title Company |
|---|---|---|---|
| Araujo Weverson D | $235,000 | None Available | |
| Hardy Robert R | -- | -- |
Source: Public Records
Tax History Compared to Growth
Tax History
| Year | Tax Paid | Tax Assessment Tax Assessment Total Assessment is a certain percentage of the fair market value that is determined by local assessors to be the total taxable value of land and additions on the property. | Land | Improvement |
|---|---|---|---|---|
| 2025 | $3,494 | $238,800 | $135,000 | $103,800 |
| 2024 | $3,184 | $221,900 | $122,100 | $99,800 |
| 2023 | $3,261 | $215,400 | $122,100 | $93,300 |
| 2022 | $3,339 | $194,700 | $109,300 | $85,400 |
| 2021 | $3,163 | $176,500 | $96,400 | $80,100 |
| 2020 | $2,997 | $176,500 | $96,400 | $80,100 |
| 2019 | $3,759 | $226,600 | $90,000 | $136,600 |
| 2018 | $3,714 | $226,600 | $90,000 | $136,600 |
| 2017 | $5,361 | $337,400 | $90,000 | $247,400 |
| 2016 | $5,096 | $308,300 | $90,000 | $218,300 |
| 2015 | $4,917 | $308,300 | $90,000 | $218,300 |
| 2014 | $4,775 | $301,100 | $90,000 | $211,100 |
Source: Public Records
Map
Nearby Homes
- 103 Main St Unit 23
- 22 River Rd
- 38 River Rd Unit 11
- 10 Tucker St
- 12 Chace Ave
- 8 Tucker Park Unit D
- 17 Chace Ave
- 38 Tarbell St Unit 5B
- 25 Chace Ave
- 3 Nashua Rd
- 34 Lowell Rd Unit 13
- 7 Elm St
- 11 Shawnee Rd
- 573 Longley Rd
- 46 Lowell Rd
- 23 Shawnee Rd Unit 23
- 16 Village Rd
- 46 Brookline St
- 6 Mason St Unit 59
- 14 Nova Dr Unit A