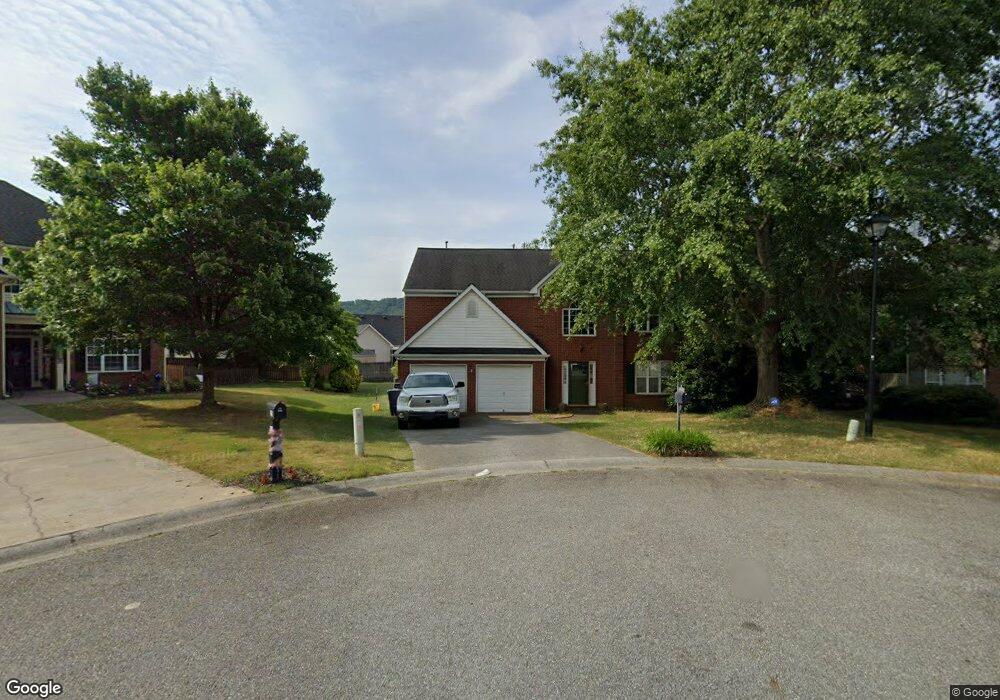
17 Hitchcock Station NE Unit 160 Cartersville, GA 30121
Estimated Value: $365,904 - $397,000
3
Beds
3
Baths
2,400
Sq Ft
$159/Sq Ft
Est. Value
About This Home
This home is located at 17 Hitchcock Station NE Unit 160, Cartersville, GA 30121 and is currently estimated at $382,476, approximately $159 per square foot. 17 Hitchcock Station NE Unit 160 is a home located in Bartow County with nearby schools including Cloverleaf Elementary School, Red Top Middle School, and Woodland High School.
Ownership History
Date
Name
Owned For
Owner Type
Purchase Details
Closed on
Jan 30, 2018
Sold by
Buchberger David Arthur
Bought by
Trentan Garrett and Garrett Katelynn
Current Estimated Value
Home Financials for this Owner
Home Financials are based on the most recent Mortgage that was taken out on this home.
Original Mortgage
$179,685
Outstanding Balance
$152,024
Interest Rate
3.95%
Mortgage Type
FHA
Estimated Equity
$230,452
Purchase Details
Closed on
Sep 25, 2014
Sold by
Corrigan Steven J
Bought by
Buchberger Douglas Arthur
Home Financials for this Owner
Home Financials are based on the most recent Mortgage that was taken out on this home.
Original Mortgage
$147,959
Interest Rate
4.16%
Mortgage Type
New Conventional
Create a Home Valuation Report for This Property
The Home Valuation Report is an in-depth analysis detailing your home's value as well as a comparison with similar homes in the area
Home Values in the Area
Average Home Value in this Area
Purchase History
| Date | Buyer | Sale Price | Title Company |
|---|---|---|---|
| Trentan Garrett | $183,000 | -- | |
| Buchberger Douglas Arthur | $142,500 | -- | |
| Buchberger Douglas Arthur | -- | -- |
Source: Public Records
Mortgage History
| Date | Status | Borrower | Loan Amount |
|---|---|---|---|
| Open | Trentan Garrett | $179,685 | |
| Previous Owner | Buchberger Douglas Arthur | $147,959 |
Source: Public Records
Tax History Compared to Growth
Tax History
| Year | Tax Paid | Tax Assessment Tax Assessment Total Assessment is a certain percentage of the fair market value that is determined by local assessors to be the total taxable value of land and additions on the property. | Land | Improvement |
|---|---|---|---|---|
| 2024 | $3,469 | $142,743 | $29,600 | $113,143 |
| 2023 | $3,469 | $142,800 | $28,000 | $114,800 |
| 2022 | $2,784 | $109,666 | $14,000 | $95,666 |
| 2021 | $2,131 | $79,888 | $14,000 | $65,888 |
| 2020 | $2,085 | $75,888 | $10,000 | $65,888 |
| 2019 | $2,032 | $73,776 | $10,000 | $63,776 |
| 2018 | $1,944 | $69,793 | $10,000 | $59,793 |
| 2017 | $1,576 | $56,280 | $8,000 | $48,280 |
| 2016 | $1,588 | $56,280 | $8,000 | $48,280 |
| 2015 | $1,611 | $57,000 | $8,000 | $49,000 |
| 2014 | $1,445 | $54,520 | $10,000 | $44,520 |
| 2013 | -- | $44,040 | $10,000 | $34,040 |
Source: Public Records
Map
Nearby Homes
- 111 Sunflower Cir NE
- 25 Mallet Pointe NE
- 23 Equestrian Way NE
- 84 Cline-Smith Rd
- 31 Churchill Downs NE
- 173 Cline Smith Rd NE
- 266 Eva Way
- 332 Melody Ln
- 88 Cline Smith Rd NE
- 203 Daisy Ct NE
- 206 Daisy Ct
- 204 Daisy Ct NE
- 200 Daisy Ct
- 141 Sunflower Cir
- 138 Sunflower Cir NE
- 143 Sunflower Cir NE
- 52 Buena Vista Cir SE
- 215 Dupont Dr
- 19 Roving Hills Cir
- 9 Marguerite Dr
- 17 Hitchcock Station NE
- 15 Hitchcock Station NE Unit 161
- 15 Hitchcock Station NE
- 16 Hitchcock Station NE
- 21 Mallet Pointe NE
- 25 Mallet Pte NE Unit 145
- 25 Mallet Pte NE
- 23 Mallet Pte NE
- 23 Mallet Pointe NE
- 25 Mallet Point Unit 145
- 25 Mallet Point
- 0 Mallet Point NE Unit 8173252
- 0 Mallet Point NE Unit 3079019
- 0 Mallet Point NE Unit 3206839
- 0 Mallet Point NE
- 23 Mallet Point
- 14 Hitchcock Station NE
- 19 Mallet Pointe NE
- 19 Mallet Point
- 19 Mallet Pte