Estimated Value: $368,230 - $544,000
3
Beds
2
Baths
1,080
Sq Ft
$429/Sq Ft
Est. Value
About This Home
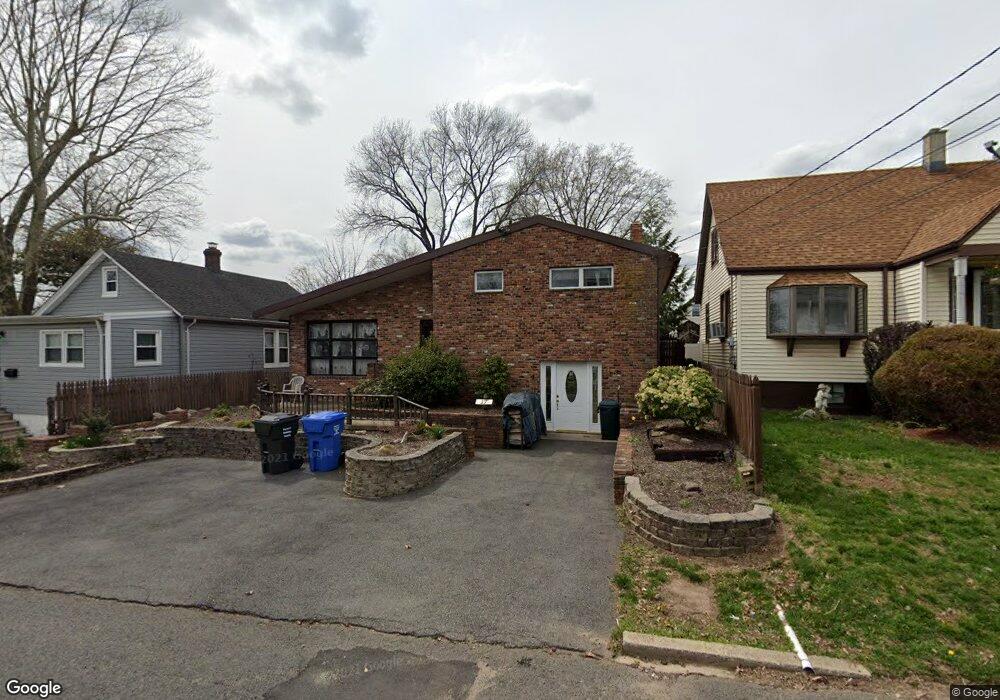
This home is located at 17 Hornsby St, Fords, NJ 08863 and is currently estimated at $463,308, approximately $428 per square foot. 17 Hornsby St is a home located in Middlesex County with nearby schools including Menlo Park Terrace School, Fords Middle School, and Woodbridge High School.
Ownership History
Date
Name
Owned For
Owner Type
Purchase Details
Closed on
Nov 18, 2019
Sold by
Swanick Betty F and Vroom Deborah S
Bought by
Topuria Tony
Current Estimated Value
Home Financials for this Owner
Home Financials are based on the most recent Mortgage that was taken out on this home.
Original Mortgage
$274,928
Outstanding Balance
$240,744
Interest Rate
3.37%
Mortgage Type
FHA
Estimated Equity
$222,564
Purchase Details
Closed on
Jun 28, 2017
Sold by
Vroom Deborah S and Estate Of David J Swanlck Sr
Bought by
Swanick Betty F
Create a Home Valuation Report for This Property
The Home Valuation Report is an in-depth analysis detailing your home's value as well as a comparison with similar homes in the area
Home Values in the Area
Average Home Value in this Area
Purchase History
| Date | Buyer | Sale Price | Title Company |
|---|---|---|---|
| Topuria Tony | $280,000 | All Ahead Title Agency | |
| Swanick Betty F | -- | None Available |
Source: Public Records
Mortgage History
| Date | Status | Borrower | Loan Amount |
|---|---|---|---|
| Open | Topuria Tony | $274,928 |
Source: Public Records
Tax History Compared to Growth
Tax History
| Year | Tax Paid | Tax Assessment Tax Assessment Total Assessment is a certain percentage of the fair market value that is determined by local assessors to be the total taxable value of land and additions on the property. | Land | Improvement |
|---|---|---|---|---|
| 2025 | $9,432 | $74,700 | $20,000 | $54,700 |
| 2024 | $9,157 | $74,700 | $20,000 | $54,700 |
| 2023 | $9,157 | $74,700 | $20,000 | $54,700 |
| 2022 | $8,911 | $74,700 | $20,000 | $54,700 |
| 2021 | $8,809 | $74,700 | $20,000 | $54,700 |
| 2020 | $8,224 | $72,000 | $20,000 | $52,000 |
| 2019 | $8,012 | $72,000 | $20,000 | $52,000 |
| 2018 | $7,854 | $72,000 | $20,000 | $52,000 |
| 2017 | $7,716 | $72,000 | $20,000 | $52,000 |
| 2016 | $7,652 | $72,000 | $20,000 | $52,000 |
| 2015 | $7,503 | $72,000 | $20,000 | $52,000 |
| 2014 | $7,340 | $72,000 | $20,000 | $52,000 |
Source: Public Records
Map
Nearby Homes
- 40 Ling St
- 21 Douglas St
- 450 Crows Mill Rd
- 12 Liberty St
- 59 Douglas St
- 1 Olive St
- 805 King Georges Rd
- 805 King George Rd
- 10 Mary Ave
- 29 S Columbus Ave
- 179 Liberty St
- 91 Corey St
- 636 King Georges Rd
- 46 3rd St
- 56 Ford Ave
- 34 Maple Ave
- 163 Winchester Rd
- 99 Crestview Rd
- 16 Emmett Ave
- 71 Pennsylvania Ave