
Landlord's Agent in 2022
Gil Propp
Coldwell Banker Realty - Brookline
3 Total Sales
Estimated Value: $751,000 - $934,000
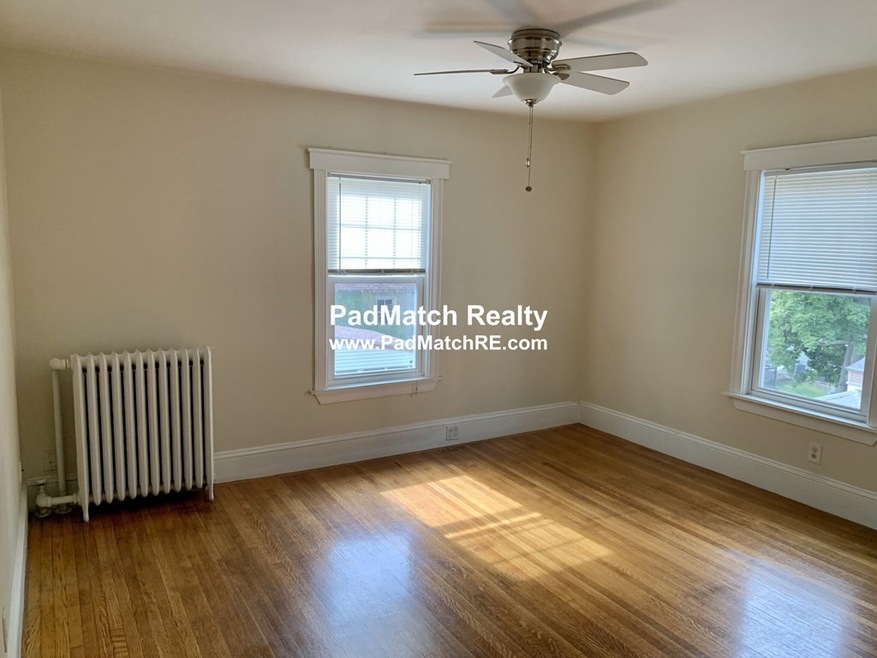
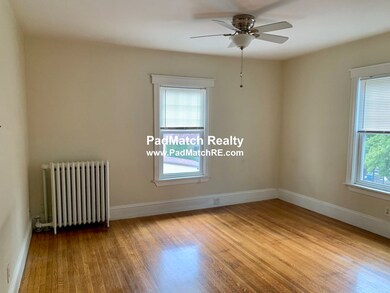
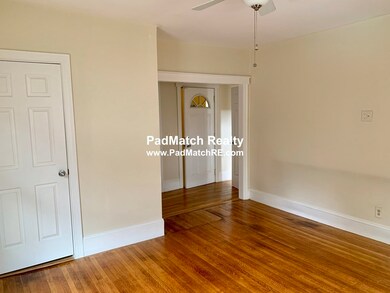
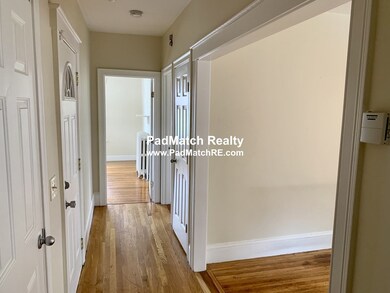
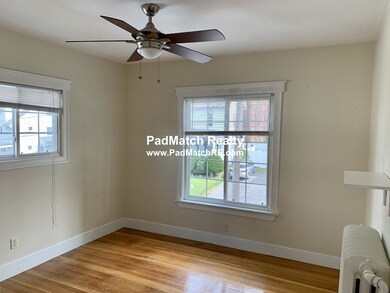
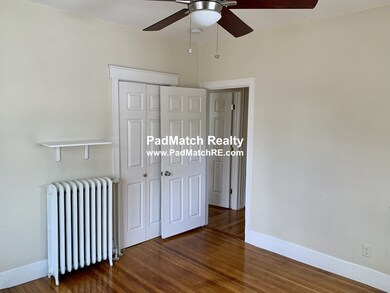
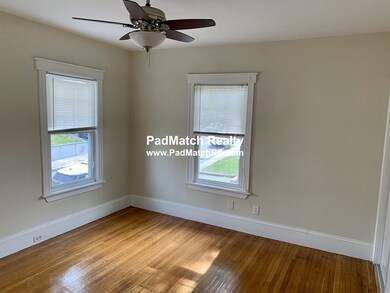
Bright and spacious Bell Rock three-bedroom/one-bathroom duplex apartment near everything Malden has to offer! Available for immediate move-in. Unit is on the second and third floors of a tastefully updated two-unit house with two included outdoor parking spaces, a private basement storage unit and a common backyard! First floor features a living room, two front-facing bedrooms and a fully-applianced eat-in kitchen. Off the kitchen are a private screened porch and the unit’s laundry room. Upstairs are the third bedroom and a spacious high ceilinged common area; the upstairs could also be configured as a very large bedroom with an office. Tons of closet space throughout the unit! Cats welcome. Bell Rock Park and Northern Strand Community Trail steps away!
| Date | Buyer | Sale Price | Title Company |
|---|---|---|---|
| Maia Marcelo P | $910,000 | None Available | |
| Maia Marcelo P | $910,000 | None Available | |
| Carroll Francine M | $190,100 | -- | |
| Carroll Francine M | $190,100 | -- | |
| Carroll Francine M | $190,100 | -- |
| Date | Status | Borrower | Loan Amount |
|---|---|---|---|
| Open | Maia Marcelo P | $864,500 | |
| Closed | Maia Marcelo P | $864,500 | |
| Previous Owner | Carroll Francine M | $35,000 | |
| Previous Owner | Carroll Francine M | $10,000 | |
| Previous Owner | Carroll Francine M | $200,000 |
| Date | Event | Price | List to Sale | Price per Sq Ft |
|---|---|---|---|---|
| 10/10/2022 10/10/22 | Rented | $2,300 | 0.0% | -- |
| 10/10/2022 10/10/22 | Under Contract | -- | -- | -- |
| 09/30/2022 09/30/22 | For Rent | $2,300 | -- | -- |
| Year | Tax Paid | Tax Assessment Tax Assessment Total Assessment is a certain percentage of the fair market value that is determined by local assessors to be the total taxable value of land and additions on the property. | Land | Improvement |
|---|---|---|---|---|
| 2025 | $7,725 | $682,400 | $315,300 | $367,100 |
| 2024 | $7,510 | $642,400 | $298,200 | $344,200 |
| 2023 | $7,257 | $595,300 | $272,700 | $322,600 |
| 2022 | $6,915 | $559,900 | $247,100 | $312,800 |
| 2021 | $6,889 | $560,500 | $225,800 | $334,700 |
| 2020 | $6,309 | $498,700 | $214,700 | $284,000 |
| 2019 | $6,309 | $475,400 | $204,500 | $270,900 |
| 2018 | $6,049 | $429,300 | $172,600 | $256,700 |
| 2017 | $5,922 | $417,900 | $172,600 | $245,300 |
| 2016 | $5,730 | $378,000 | $164,000 | $214,000 |
| 2015 | $5,509 | $350,200 | $154,700 | $195,500 |
| 2014 | $5,144 | $319,500 | $140,600 | $178,900 |
Landlord's Agent in 2022
Gil Propp
Coldwell Banker Realty - Brookline
3 Total Sales
Source: MLS Property Information Network (MLS PIN)
MLS Number: 73043185
APN: MALD-000067-000318-000812
Disclaimer: Certain information contained herein is derived from information provided by parties other than Homes.com. All information provided is deemed reliable, but is not guaranteed to be accurate and should be independently verified.
![]() The property listing data and information, or the Images, set forth herein were provided to MLS Property Information Network, Inc. from third party sources, including sellers, lessors and public records, and were compiled by MLS Property Information Network, Inc. The property listing data and information, and the Images, are for the personal, non-commercial use of consumers having a good faith interest in purchasing or leasing listed properties of the type displayed to them and may not be used for any purpose other than to identify prospective properties which such consumers may have a good faith interest in purchasing or leasing. MLS Property Information Network, Inc. and its subscribers disclaim any and all representations and warranties as to the accuracy of the property listing data and information, or as to the accuracy of any of the Images, set forth herein.
The property listing data and information, or the Images, set forth herein were provided to MLS Property Information Network, Inc. from third party sources, including sellers, lessors and public records, and were compiled by MLS Property Information Network, Inc. The property listing data and information, and the Images, are for the personal, non-commercial use of consumers having a good faith interest in purchasing or leasing listed properties of the type displayed to them and may not be used for any purpose other than to identify prospective properties which such consumers may have a good faith interest in purchasing or leasing. MLS Property Information Network, Inc. and its subscribers disclaim any and all representations and warranties as to the accuracy of the property listing data and information, or as to the accuracy of any of the Images, set forth herein.