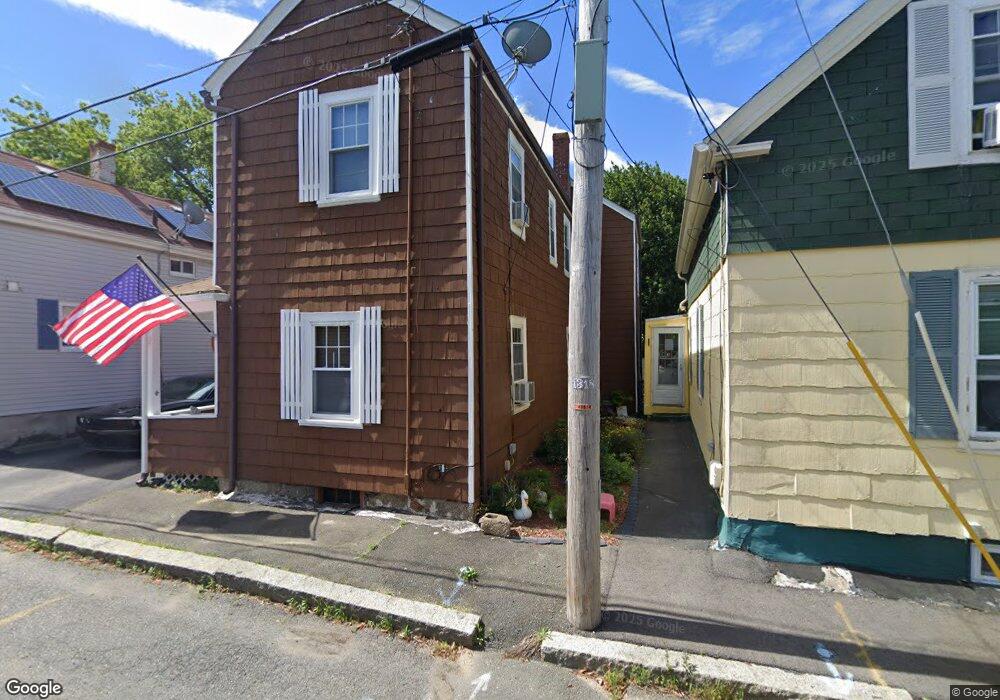
17 Hubon St Salem, MA 01970
Bridge Street NeighborhoodEstimated Value: $485,000 - $594,000
2
Beds
2
Baths
1,321
Sq Ft
$400/Sq Ft
Est. Value
About This Home
This home is located at 17 Hubon St, Salem, MA 01970 and is currently estimated at $528,280, approximately $399 per square foot. 17 Hubon St is a home located in Essex County with nearby schools including Carlton Elementary School, Saltonstall School, and Bates Elementary School.
Ownership History
Date
Name
Owned For
Owner Type
Purchase Details
Closed on
Apr 30, 1997
Sold by
Howe Scott L and Howe Catherine
Bought by
Murtaugh Patrick D
Current Estimated Value
Home Financials for this Owner
Home Financials are based on the most recent Mortgage that was taken out on this home.
Original Mortgage
$91,500
Interest Rate
7.85%
Mortgage Type
Purchase Money Mortgage
Purchase Details
Closed on
Aug 7, 1987
Sold by
Murtaugh David A
Bought by
Howe Scott L
Create a Home Valuation Report for This Property
The Home Valuation Report is an in-depth analysis detailing your home's value as well as a comparison with similar homes in the area
Home Values in the Area
Average Home Value in this Area
Purchase History
| Date | Buyer | Sale Price | Title Company |
|---|---|---|---|
| Murtaugh Patrick D | $101,750 | -- | |
| Howe Scott L | $117,500 | -- |
Source: Public Records
Mortgage History
| Date | Status | Borrower | Loan Amount |
|---|---|---|---|
| Open | Howe Scott L | $85,500 | |
| Closed | Howe Scott L | $91,500 | |
| Closed | Howe Scott L | $91,500 | |
| Previous Owner | Howe Scott L | $98,000 |
Source: Public Records
Tax History Compared to Growth
Tax History
| Year | Tax Paid | Tax Assessment Tax Assessment Total Assessment is a certain percentage of the fair market value that is determined by local assessors to be the total taxable value of land and additions on the property. | Land | Improvement |
|---|---|---|---|---|
| 2025 | $4,398 | $387,800 | $156,900 | $230,900 |
| 2024 | $4,248 | $365,600 | $148,600 | $217,000 |
| 2023 | $4,053 | $324,000 | $137,600 | $186,400 |
| 2022 | $4,019 | $303,300 | $129,400 | $173,900 |
| 2021 | $4,075 | $295,300 | $129,400 | $165,900 |
| 2020 | $3,841 | $265,800 | $111,800 | $154,000 |
| 2019 | $3,820 | $253,000 | $106,200 | $146,800 |
| 2018 | $3,705 | $240,900 | $101,300 | $139,600 |
| 2017 | $3,392 | $213,900 | $82,600 | $131,300 |
| 2016 | $3,283 | $209,500 | $78,200 | $131,300 |
| 2015 | $3,179 | $193,700 | $70,500 | $123,200 |
Source: Public Records
Map
Nearby Homes
- 12 Thorndike St
- 14 Lathrop St
- 103 Bridge St Unit 2
- 43 Front St
- 21 Summit Ave Unit 2
- 117 Water St Unit 28
- 5 Larchmont Rd Unit 3
- 7 Lothrop St
- 41 Dearborn St
- 7 Oxford Terrace
- 10 Andrew St Unit 2A
- 156 Bridge St Unit A
- 156 Bridge St Unit B
- 40 & 40R Stone St
- 60 Rantoul St Unit 711N
- 1 Quincy Park
- 21 Emerton St Unit 2
- 12 Fayette St Unit 4
- 26 Winter St
- 9.5 Fayette Unit 9.5