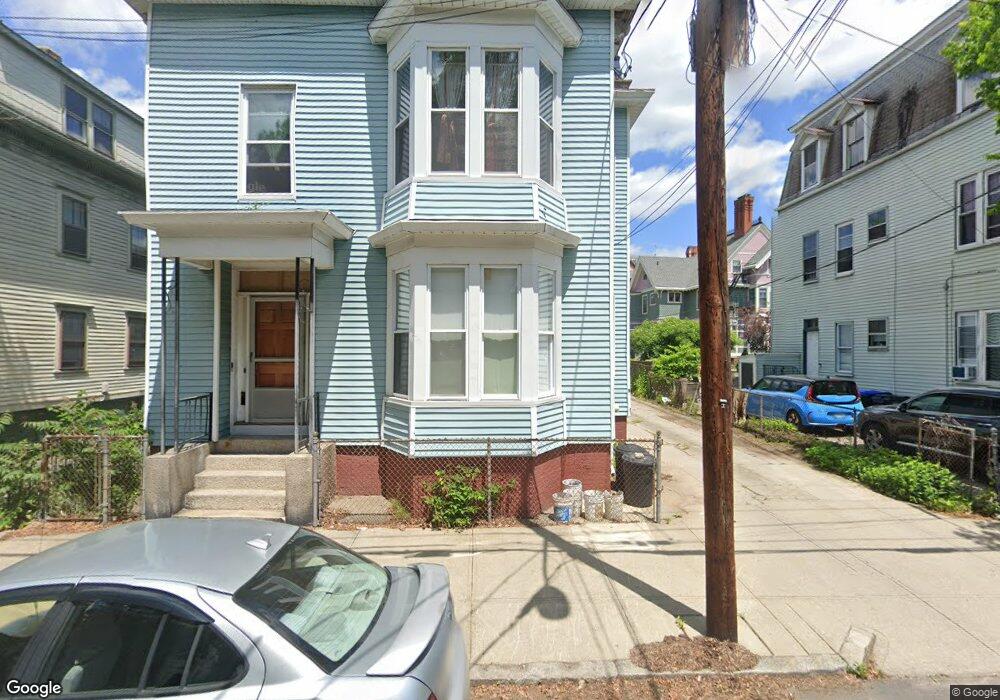
17 Hudson St Providence, RI 02909
West End NeighborhoodEstimated Value: $490,000 - $999,000
8
Beds
3
Baths
3,918
Sq Ft
$202/Sq Ft
Est. Value
About This Home
This home is located at 17 Hudson St, Providence, RI 02909 and is currently estimated at $790,667, approximately $201 per square foot. 17 Hudson St is a home located in Providence County with nearby schools including Asa Messer Elementary School, Charles N. Fortes Elementary School, and Alfred Lima Sr. Elementary School.
Ownership History
Date
Name
Owned For
Owner Type
Purchase Details
Closed on
Sep 2, 1997
Sold by
Degaitas Henry J
Bought by
Em Vanna and Chhoeur Peth
Current Estimated Value
Home Financials for this Owner
Home Financials are based on the most recent Mortgage that was taken out on this home.
Original Mortgage
$63,000
Outstanding Balance
$9,712
Interest Rate
7.41%
Mortgage Type
Purchase Money Mortgage
Estimated Equity
$780,955
Create a Home Valuation Report for This Property
The Home Valuation Report is an in-depth analysis detailing your home's value as well as a comparison with similar homes in the area
Home Values in the Area
Average Home Value in this Area
Purchase History
| Date | Buyer | Sale Price | Title Company |
|---|---|---|---|
| Em Vanna | $70,000 | -- |
Source: Public Records
Mortgage History
| Date | Status | Borrower | Loan Amount |
|---|---|---|---|
| Open | Em Vanna | $63,000 |
Source: Public Records
Tax History Compared to Growth
Tax History
| Year | Tax Paid | Tax Assessment Tax Assessment Total Assessment is a certain percentage of the fair market value that is determined by local assessors to be the total taxable value of land and additions on the property. | Land | Improvement |
|---|---|---|---|---|
| 2024 | $10,206 | $556,200 | $197,200 | $359,000 |
| 2023 | $10,206 | $556,200 | $197,200 | $359,000 |
| 2022 | $9,900 | $556,200 | $197,200 | $359,000 |
| 2021 | $8,493 | $345,800 | $131,600 | $214,200 |
| 2020 | $8,493 | $345,800 | $131,600 | $214,200 |
| 2019 | $8,493 | $345,800 | $131,600 | $214,200 |
| 2018 | $7,712 | $241,300 | $112,800 | $128,500 |
| 2017 | $7,712 | $241,300 | $112,800 | $128,500 |
| 2016 | $7,712 | $241,300 | $112,800 | $128,500 |
| 2015 | $7,017 | $212,000 | $112,800 | $99,200 |
| 2014 | $7,155 | $212,000 | $112,800 | $99,200 |
| 2013 | $7,155 | $212,000 | $112,800 | $99,200 |
Source: Public Records
Map
Nearby Homes
- 32 Oak St Unit 2
- 24 Wood St Unit 1
- 43 Chapin Ave Unit 2
- 43 Chapin Ave Unit 5
- 6 Slocum St Unit 16
- 15 Wendell St
- 30 Messer St
- 21 Harkness St Unit 2
- 124 Chapin Ave
- 35 Harkness St
- 147 Hudson St
- 157 Chapin Ave
- 89 Superior St
- 65 Grant St
- 498 Broadway
- 30 Rosedale St
- 1 Ware Ct
- 50 Tobey St
- 21 Grant St
- 90 Grove St