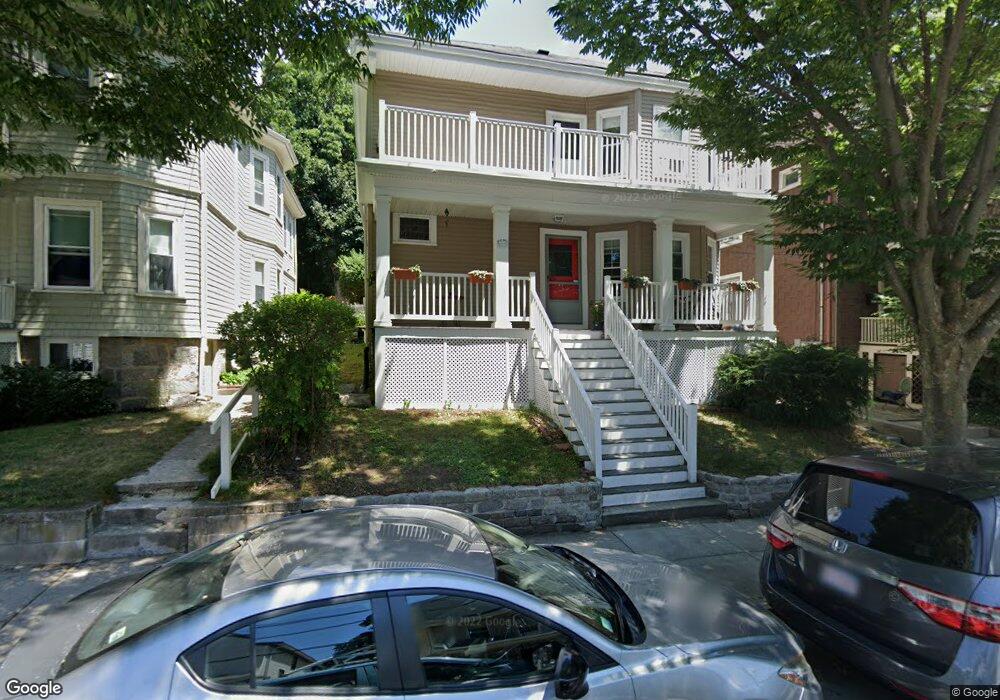
17 Hunnewell Ave Brighton, MA 02135
Brighton NeighborhoodEstimated Value: $1,142,000 - $1,241,603
6
Beds
3
Baths
2,874
Sq Ft
$412/Sq Ft
Est. Value
About This Home
This home is located at 17 Hunnewell Ave, Brighton, MA 02135 and is currently estimated at $1,182,901, approximately $411 per square foot. 17 Hunnewell Ave is a home located in Suffolk County with nearby schools including Shaloh House Jewish Day School and St Columbkille Partnership School.
Ownership History
Date
Name
Owned For
Owner Type
Purchase Details
Closed on
Jan 9, 2008
Sold by
Lacasse Ann F and Lacasse Lawrence E
Bought by
Scanlon Orla M and Scanlon Peter B
Current Estimated Value
Home Financials for this Owner
Home Financials are based on the most recent Mortgage that was taken out on this home.
Original Mortgage
$500,000
Outstanding Balance
$316,431
Interest Rate
6.21%
Mortgage Type
Purchase Money Mortgage
Estimated Equity
$866,470
Purchase Details
Closed on
Apr 7, 2005
Sold by
Lacasse Ft
Bought by
Lacasse Ann F and Lacasse Lawrence E
Create a Home Valuation Report for This Property
The Home Valuation Report is an in-depth analysis detailing your home's value as well as a comparison with similar homes in the area
Home Values in the Area
Average Home Value in this Area
Purchase History
| Date | Buyer | Sale Price | Title Company |
|---|---|---|---|
| Scanlon Orla M | $533,000 | -- | |
| Lacasse Ann F | -- | -- |
Source: Public Records
Mortgage History
| Date | Status | Borrower | Loan Amount |
|---|---|---|---|
| Open | Scanlon Orla M | $500,000 |
Source: Public Records
Tax History Compared to Growth
Tax History
| Year | Tax Paid | Tax Assessment Tax Assessment Total Assessment is a certain percentage of the fair market value that is determined by local assessors to be the total taxable value of land and additions on the property. | Land | Improvement |
|---|---|---|---|---|
| 2025 | $12,305 | $1,062,600 | $330,700 | $731,900 |
| 2024 | $10,497 | $963,000 | $318,900 | $644,100 |
| 2023 | $9,577 | $891,700 | $295,300 | $596,400 |
| 2022 | $9,239 | $849,200 | $281,200 | $568,000 |
| 2021 | $9,061 | $849,200 | $281,200 | $568,000 |
| 2020 | $8,909 | $843,700 | $249,600 | $594,100 |
| 2019 | $8,633 | $819,100 | $201,800 | $617,300 |
| 2018 | $8,020 | $765,300 | $201,800 | $563,500 |
| 2017 | $7,946 | $750,300 | $201,800 | $548,500 |
| 2016 | $7,503 | $682,100 | $201,800 | $480,300 |
| 2015 | $6,816 | $562,800 | $184,000 | $378,800 |
| 2014 | $6,248 | $496,700 | $184,000 | $312,700 |
Source: Public Records
Map
Nearby Homes
- 8 Tremont Place
- 664 Washington St
- 14 Atkins St
- 99 Tremont St Unit 413
- 99 Tremont St Unit 105
- 99 Tremont St Unit 205
- 365 Faneuil St Unit 2
- 357 Faneuil St Unit 12
- 121 Tremont St Unit B1
- 69 Presentation Rd
- 36-38 Bostonia Ave
- 21 Glenley Terrace
- 21 Upcrest Rd
- 150 Nonantum St
- 107 Bigelow St Unit 2
- 110 Bigelow St
- 165 Bigelow St
- 34 Larch St Unit 34
- 32 Larch St Unit 34
- 66 Hobson St
- 17 Hunnewell Ave
- 17 Hunnewell Ave Unit 2
- 21 Hunnewell Ave
- 21 Hunnewell Ave Unit 2
- 11 Hunnewell Ave Unit 15
- 15 Hunnewell Ave Unit 2
- 25 Hunnewell Ave
- 25 Hunnewell Ave
- 25 Hunnewell Ave Unit 2
- 9 Hunnewell Ave Unit 1
- 9 Hunnewell Ave Unit 2
- 9 Hunnewell Ave Unit 3
- 7 Hunnewell Ave
- 7 Hunnewell Ave Unit 2
- 7 Hunnewell Ave Unit 1
- 7 Hunnewell Ave Unit 3
- 20 Hunnewell Ave
- 20 Hunnewell Ave Unit 1
- 20 Hunnewell Ave Unit 28 Hunnewell Avenue
- 29 Hunnewell Ave Unit 31