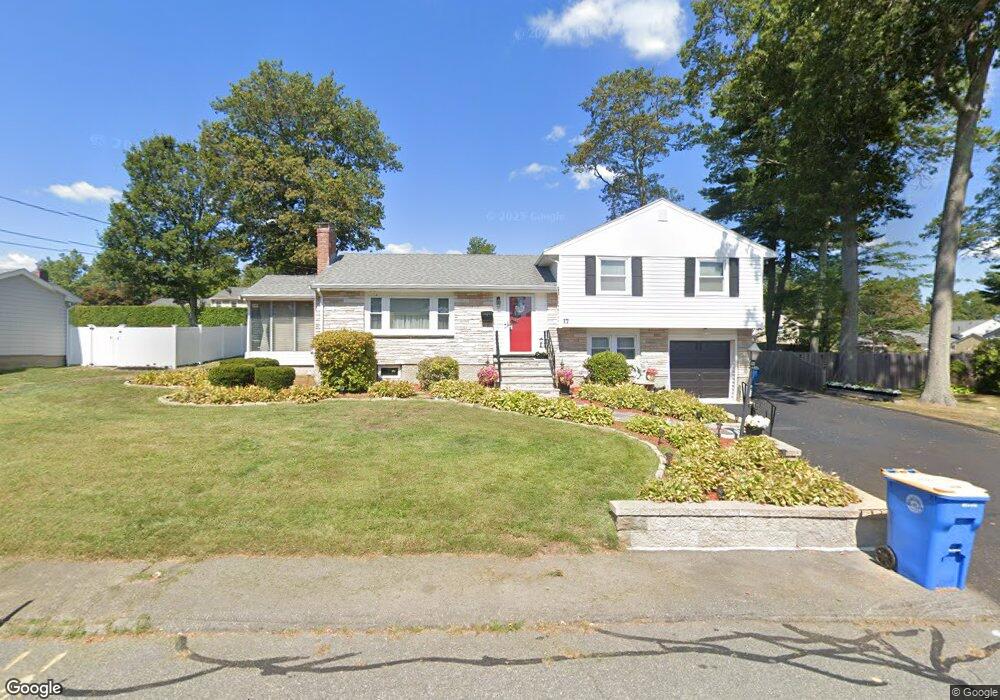
17 Imrie St Randolph, MA 02368
North Randolph NeighborhoodEstimated Value: $624,310 - $730,000
3
Beds
2
Baths
1,248
Sq Ft
$528/Sq Ft
Est. Value
About This Home
This home is located at 17 Imrie St, Randolph, MA 02368 and is currently estimated at $659,078, approximately $528 per square foot. 17 Imrie St is a home located in Norfolk County with nearby schools including Randolph High School.
Ownership History
Date
Name
Owned For
Owner Type
Purchase Details
Closed on
Apr 11, 2012
Sold by
Weekes Neville G
Bought by
Weekes Jennifer M
Current Estimated Value
Purchase Details
Closed on
Nov 18, 2002
Sold by
Esteghamati Michael and Esteghamati Leslie
Bought by
Weekes Neville G and Weekes Jennifer M
Home Financials for this Owner
Home Financials are based on the most recent Mortgage that was taken out on this home.
Original Mortgage
$268,000
Interest Rate
6.03%
Mortgage Type
Purchase Money Mortgage
Purchase Details
Closed on
Nov 30, 1998
Sold by
Dembling David A and Dembling Adele D
Bought by
Esteghamati Mcihael and Esteghamati Lislie
Home Financials for this Owner
Home Financials are based on the most recent Mortgage that was taken out on this home.
Original Mortgage
$100,000
Interest Rate
6.83%
Mortgage Type
Purchase Money Mortgage
Create a Home Valuation Report for This Property
The Home Valuation Report is an in-depth analysis detailing your home's value as well as a comparison with similar homes in the area
Home Values in the Area
Average Home Value in this Area
Purchase History
| Date | Buyer | Sale Price | Title Company |
|---|---|---|---|
| Weekes Jennifer M | -- | -- | |
| Weekes Neville G | $335,000 | -- | |
| Esteghamati Mcihael | $169,900 | -- |
Source: Public Records
Mortgage History
| Date | Status | Borrower | Loan Amount |
|---|---|---|---|
| Previous Owner | Weekes Neville G | $268,000 | |
| Previous Owner | Esteghamati Mcihael | $137,000 | |
| Previous Owner | Esteghamati Mcihael | $20,000 | |
| Previous Owner | Esteghamati Mcihael | $100,000 |
Source: Public Records
Tax History Compared to Growth
Tax History
| Year | Tax Paid | Tax Assessment Tax Assessment Total Assessment is a certain percentage of the fair market value that is determined by local assessors to be the total taxable value of land and additions on the property. | Land | Improvement |
|---|---|---|---|---|
| 2025 | $6,022 | $518,700 | $253,300 | $265,400 |
| 2024 | $5,882 | $513,700 | $248,300 | $265,400 |
| 2023 | $5,510 | $456,100 | $225,700 | $230,400 |
| 2022 | $5,513 | $405,400 | $188,200 | $217,200 |
| 2021 | $5,532 | $374,300 | $156,800 | $217,500 |
| 2020 | $5,387 | $361,300 | $156,800 | $204,500 |
| 2019 | $5,159 | $344,400 | $149,300 | $195,100 |
| 2018 | $4,864 | $306,300 | $135,700 | $170,600 |
| 2017 | $4,679 | $289,200 | $129,200 | $160,000 |
| 2016 | $4,601 | $264,600 | $117,500 | $147,100 |
| 2015 | $4,625 | $255,500 | $112,000 | $143,500 |
Source: Public Records
Map
Nearby Homes
- 232 Canton St Unit 104
- 232 Canton St Unit 205
- 232 Canton St Unit 112
- 1603 Irving Rd
- 1307 Irving Rd
- 10 Michael Rd
- 11 Glen Ln
- 3 Franklin Square Unit H
- 14 Anderson Dr
- 19 Cynthia Rd
- 317 Chestnut St
- 39 Marion St
- 240 York St
- 68 High St
- 8 Robert Rd Unit R
- 974 N Main St Unit 3
- 17 Hills St
- 2 Smith Rd
- 9 Royal Crest Dr Unit 12
- 29 Decota Dr