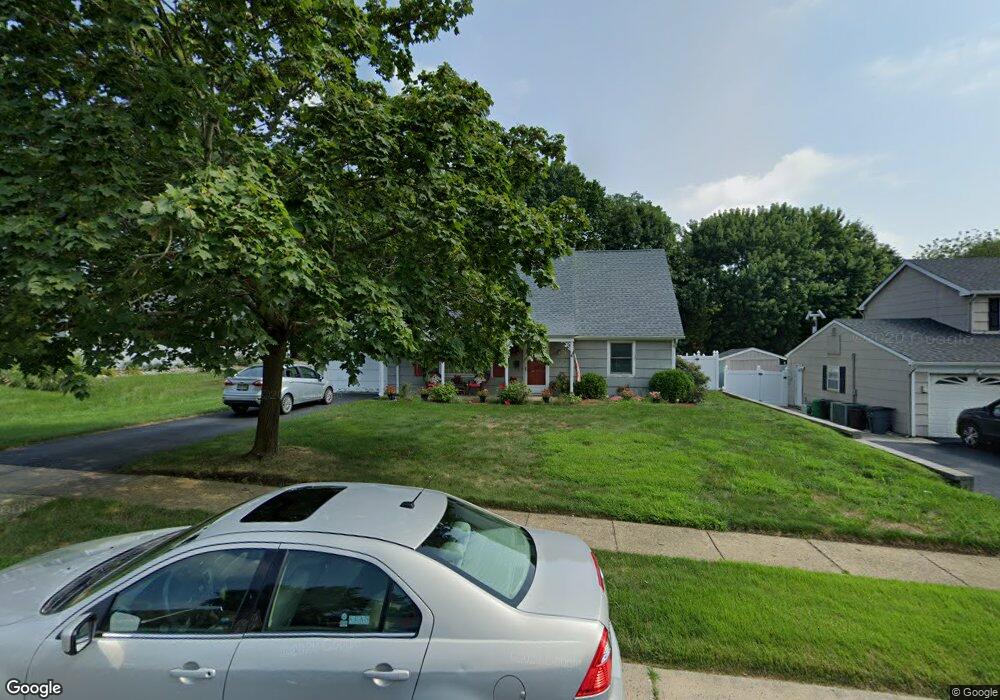
17 Infield Ln Matawan, NJ 07747
Estimated Value: $643,882 - $691,000
4
Beds
2
Baths
1,541
Sq Ft
$432/Sq Ft
Est. Value
About This Home
This home is located at 17 Infield Ln, Matawan, NJ 07747 and is currently estimated at $665,471, approximately $431 per square foot. 17 Infield Ln is a home located in Monmouth County with nearby schools including Matawan Reg High School, St Benedict School, and St. John Vianney Regional High School.
Ownership History
Date
Name
Owned For
Owner Type
Purchase Details
Closed on
Oct 28, 1997
Sold by
Warren William
Bought by
Mulcahy Timothy and Mulcahy Carole Buff
Current Estimated Value
Home Financials for this Owner
Home Financials are based on the most recent Mortgage that was taken out on this home.
Original Mortgage
$140,000
Outstanding Balance
$22,794
Interest Rate
7.19%
Estimated Equity
$642,677
Create a Home Valuation Report for This Property
The Home Valuation Report is an in-depth analysis detailing your home's value as well as a comparison with similar homes in the area
Home Values in the Area
Average Home Value in this Area
Purchase History
| Date | Buyer | Sale Price | Title Company |
|---|---|---|---|
| Mulcahy Timothy | $160,000 | -- |
Source: Public Records
Mortgage History
| Date | Status | Borrower | Loan Amount |
|---|---|---|---|
| Open | Mulcahy Timothy | $140,000 |
Source: Public Records
Tax History Compared to Growth
Tax History
| Year | Tax Paid | Tax Assessment Tax Assessment Total Assessment is a certain percentage of the fair market value that is determined by local assessors to be the total taxable value of land and additions on the property. | Land | Improvement |
|---|---|---|---|---|
| 2025 | $10,038 | $567,700 | $432,100 | $135,600 |
| 2024 | $9,521 | $496,700 | $363,600 | $133,100 |
| 2023 | $9,521 | $445,100 | $315,100 | $130,000 |
| 2022 | $9,190 | $378,600 | $244,600 | $134,000 |
| 2021 | $9,190 | $340,000 | $220,800 | $119,200 |
| 2020 | $9,426 | $347,300 | $230,800 | $116,500 |
| 2019 | $9,293 | $332,600 | $216,800 | $115,800 |
| 2018 | $8,885 | $318,800 | $208,300 | $110,500 |
| 2017 | $8,406 | $305,900 | $188,300 | $117,600 |
| 2016 | $7,820 | $297,000 | $182,300 | $114,700 |
| 2015 | $8,256 | $301,000 | $189,300 | $111,700 |
| 2014 | $7,836 | $291,300 | $180,300 | $111,000 |
Source: Public Records
Map
Nearby Homes
- 13 Ivy Hill Dr
- 106 van Brackle Rd
- 108 Dundee Ct
- 141 Eastwick Ct Unit 141
- 75 Bradford Ct Unit 75
- 3 Avondale Ln
- 31 Balmoral Ct
- 184 Edinburgh Ct Unit 184
- 315 Wellington Place
- 3 Tolas Dr
- 111 Courtland Ln
- 9 Jubilee Cir
- 702 Wellington Place Unit 2
- 702 Wellington Place Unit 702
- 293 Gloucester Ct
- 244 Lloyd Rd
- 9 W Aspen Way
- 47 White Oak Ln
- 16 S Beers St
- 9 Tralee Rd