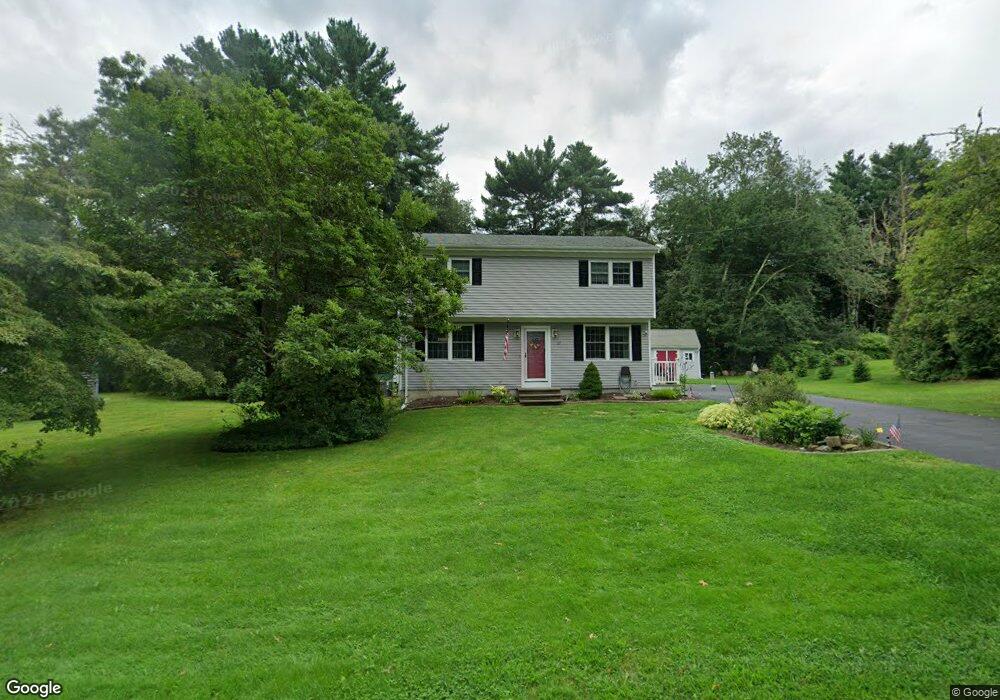
17 James Ave Westport, MA 02790
North Westport NeighborhoodEstimated Value: $501,262 - $605,000
3
Beds
2
Baths
1,472
Sq Ft
$368/Sq Ft
Est. Value
About This Home
This home is located at 17 James Ave, Westport, MA 02790 and is currently estimated at $541,066, approximately $367 per square foot. 17 James Ave is a home located in Bristol County with nearby schools including Alice A. Macomber Primary School, Westport Elementary School, and Westport Middle-High School.
Ownership History
Date
Name
Owned For
Owner Type
Purchase Details
Closed on
Nov 30, 2007
Sold by
Shea Jessica M and Shea Sean P
Bought by
Xavier Jason and Xavier Jennifer L
Current Estimated Value
Home Financials for this Owner
Home Financials are based on the most recent Mortgage that was taken out on this home.
Original Mortgage
$245,600
Interest Rate
6.48%
Mortgage Type
Purchase Money Mortgage
Purchase Details
Closed on
Sep 28, 2004
Sold by
Burns Barbara G and Burns Justin C
Bought by
Shea Jessica M and Shea Sean P
Home Financials for this Owner
Home Financials are based on the most recent Mortgage that was taken out on this home.
Original Mortgage
$278,094
Interest Rate
5.89%
Mortgage Type
Purchase Money Mortgage
Create a Home Valuation Report for This Property
The Home Valuation Report is an in-depth analysis detailing your home's value as well as a comparison with similar homes in the area
Home Values in the Area
Average Home Value in this Area
Purchase History
| Date | Buyer | Sale Price | Title Company |
|---|---|---|---|
| Xavier Jason | $307,000 | -- | |
| Shea Jessica M | $284,900 | -- |
Source: Public Records
Mortgage History
| Date | Status | Borrower | Loan Amount |
|---|---|---|---|
| Open | Shea Jessica M | $249,000 | |
| Closed | Shea Jessica M | $245,600 | |
| Previous Owner | Shea Jessica M | $278,094 |
Source: Public Records
Tax History Compared to Growth
Tax History
| Year | Tax Paid | Tax Assessment Tax Assessment Total Assessment is a certain percentage of the fair market value that is determined by local assessors to be the total taxable value of land and additions on the property. | Land | Improvement |
|---|---|---|---|---|
| 2025 | $3,090 | $414,700 | $162,100 | $252,600 |
| 2024 | $2,968 | $384,000 | $150,200 | $233,800 |
| 2023 | $2,923 | $358,200 | $136,800 | $221,400 |
| 2022 | $2,685 | $319,400 | $124,400 | $195,000 |
| 2021 | $4,161 | $311,500 | $113,100 | $198,400 |
| 2020 | $4,145 | $307,000 | $108,600 | $198,400 |
| 2019 | $2,374 | $287,100 | $108,600 | $178,500 |
| 2018 | $3,388 | $294,400 | $109,700 | $184,700 |
| 2017 | $3,243 | $279,000 | $106,200 | $172,800 |
| 2016 | $2,122 | $268,300 | $102,700 | $165,600 |
| 2015 | $1,944 | $245,100 | $105,100 | $140,000 |
Source: Public Records
Map
Nearby Homes