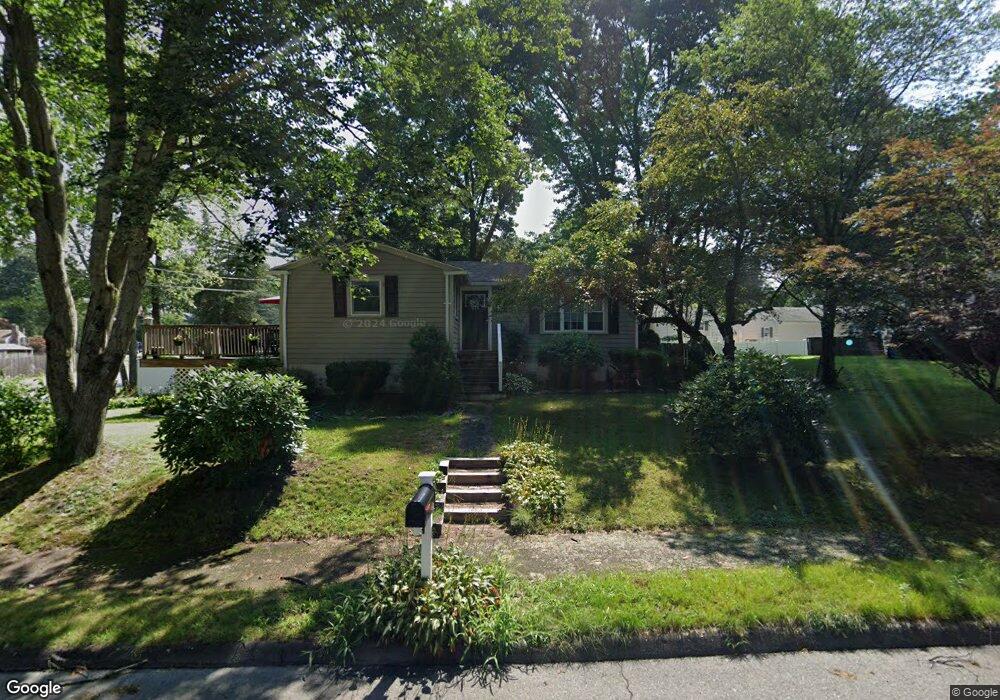
17 Jere Rd Wilmington, MA 01887
Estimated Value: $594,350 - $698,000
3
Beds
2
Baths
1,044
Sq Ft
$627/Sq Ft
Est. Value
About This Home
This home is located at 17 Jere Rd, Wilmington, MA 01887 and is currently estimated at $655,088, approximately $627 per square foot. 17 Jere Rd is a home located in Middlesex County with nearby schools including Wilmington Middle School and Wilmington High School.
Ownership History
Date
Name
Owned For
Owner Type
Purchase Details
Closed on
Jul 16, 2025
Sold by
Cianciulli Susan J
Bought by
Susan J Cianciulli T J and Susan Cianciulli
Current Estimated Value
Purchase Details
Closed on
Nov 18, 2013
Sold by
Cianciulli Francis L and Cianciulli Susan J
Bought by
Cianciulli Susan J
Purchase Details
Closed on
Jun 30, 1998
Sold by
Clark Robert N and Clark Lisa M
Bought by
Cianciulli Francis
Home Financials for this Owner
Home Financials are based on the most recent Mortgage that was taken out on this home.
Original Mortgage
$110,000
Interest Rate
7.09%
Mortgage Type
Purchase Money Mortgage
Purchase Details
Closed on
Nov 22, 1993
Sold by
Martens Michael W and Martens Patricia
Bought by
Clark Robert
Home Financials for this Owner
Home Financials are based on the most recent Mortgage that was taken out on this home.
Original Mortgage
$139,500
Interest Rate
6.77%
Mortgage Type
Purchase Money Mortgage
Create a Home Valuation Report for This Property
The Home Valuation Report is an in-depth analysis detailing your home's value as well as a comparison with similar homes in the area
Home Values in the Area
Average Home Value in this Area
Purchase History
| Date | Buyer | Sale Price | Title Company |
|---|---|---|---|
| Susan J Cianciulli T J | -- | -- | |
| Susan J Cianciulli T J | -- | -- | |
| Cianciulli Susan J | -- | -- | |
| Cianciulli Susan J | -- | -- | |
| Cianciulli Francis | $179,000 | -- | |
| Cianciulli Francis | $179,000 | -- | |
| Clark Robert | $155,000 | -- | |
| Clark Robert | $155,000 | -- |
Source: Public Records
Mortgage History
| Date | Status | Borrower | Loan Amount |
|---|---|---|---|
| Previous Owner | Clark Robert | $100,000 | |
| Previous Owner | Clark Robert | $110,000 | |
| Previous Owner | Clark Robert | $139,500 |
Source: Public Records
Tax History Compared to Growth
Tax History
| Year | Tax Paid | Tax Assessment Tax Assessment Total Assessment is a certain percentage of the fair market value that is determined by local assessors to be the total taxable value of land and additions on the property. | Land | Improvement |
|---|---|---|---|---|
| 2025 | $6,181 | $539,800 | $300,300 | $239,500 |
| 2024 | $5,956 | $521,100 | $300,300 | $220,800 |
| 2023 | $5,765 | $482,800 | $273,000 | $209,800 |
| 2022 | $5,454 | $418,600 | $227,500 | $191,100 |
| 2021 | $5,427 | $392,100 | $206,800 | $185,300 |
| 2020 | $5,159 | $379,900 | $206,800 | $173,100 |
| 2019 | $5,085 | $369,800 | $196,900 | $172,900 |
| 2018 | $4,763 | $330,500 | $187,600 | $142,900 |
| 2017 | $4,511 | $312,200 | $179,500 | $132,700 |
| 2016 | $4,323 | $295,500 | $171,000 | $124,500 |
| 2015 | $4,216 | $293,400 | $171,000 | $122,400 |
| 2014 | $3,979 | $279,400 | $162,800 | $116,600 |
Source: Public Records
Map
Nearby Homes