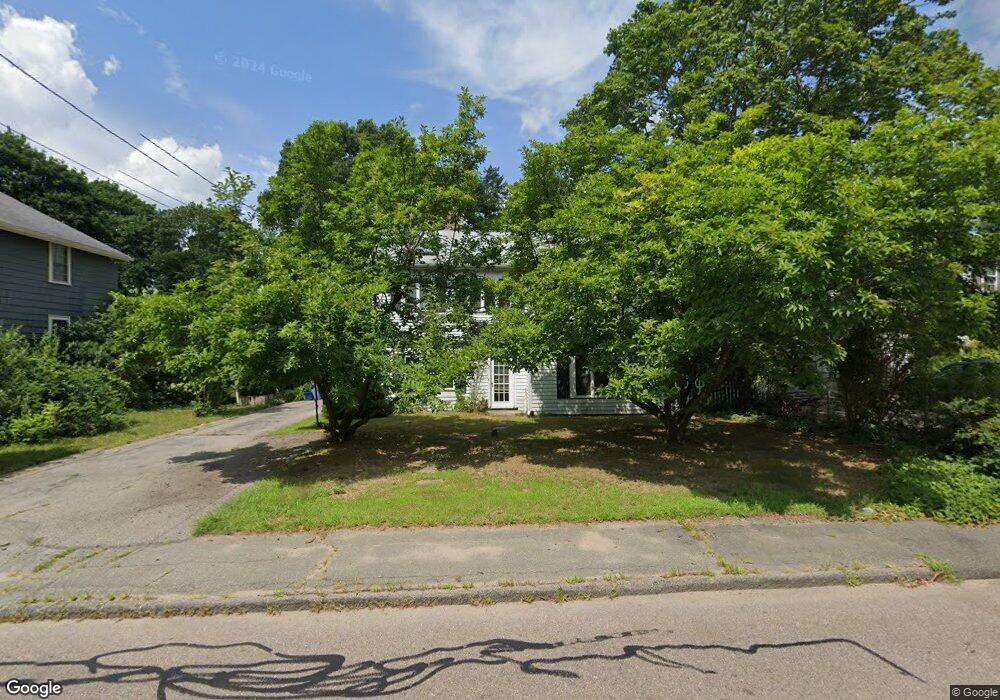
17 Johns Ave Holbrook, MA 02343
Estimated Value: $604,000 - $659,000
3
Beds
2
Baths
2,154
Sq Ft
$292/Sq Ft
Est. Value
About This Home
This home is located at 17 Johns Ave, Holbrook, MA 02343 and is currently estimated at $629,888, approximately $292 per square foot. 17 Johns Ave is a home located in Norfolk County with nearby schools including John F. Kennedy Elementary School, Holbrook Middle High School, and Boston Higashi School.
Ownership History
Date
Name
Owned For
Owner Type
Purchase Details
Closed on
Feb 7, 2013
Sold by
Platteel William A and Platteel Eniko K
Bought by
Platteel Eniko K
Current Estimated Value
Purchase Details
Closed on
Apr 24, 1995
Sold by
Werner Judith A
Bought by
Platteel William A and Platteel Eniko K
Home Financials for this Owner
Home Financials are based on the most recent Mortgage that was taken out on this home.
Original Mortgage
$79,650
Interest Rate
8.55%
Mortgage Type
Purchase Money Mortgage
Create a Home Valuation Report for This Property
The Home Valuation Report is an in-depth analysis detailing your home's value as well as a comparison with similar homes in the area
Home Values in the Area
Average Home Value in this Area
Purchase History
| Date | Buyer | Sale Price | Title Company |
|---|---|---|---|
| Platteel Eniko K | -- | -- | |
| Platteel Eniko K | -- | -- | |
| Platteel Eniko K | -- | -- | |
| Platteel William A | $88,500 | -- | |
| Platteel William A | $88,500 | -- |
Source: Public Records
Mortgage History
| Date | Status | Borrower | Loan Amount |
|---|---|---|---|
| Previous Owner | Platteel William A | $80,000 | |
| Previous Owner | Platteel William A | $79,650 |
Source: Public Records
Tax History Compared to Growth
Tax History
| Year | Tax Paid | Tax Assessment Tax Assessment Total Assessment is a certain percentage of the fair market value that is determined by local assessors to be the total taxable value of land and additions on the property. | Land | Improvement |
|---|---|---|---|---|
| 2025 | $57 | $434,700 | $215,700 | $219,000 |
| 2024 | $5,555 | $413,300 | $196,100 | $217,200 |
| 2023 | $5,655 | $367,700 | $178,300 | $189,400 |
| 2022 | $5,308 | $321,900 | $155,000 | $166,900 |
| 2021 | $5,256 | $305,200 | $144,900 | $160,300 |
| 2020 | $5,388 | $293,300 | $137,000 | $156,300 |
| 2019 | $5,371 | $276,000 | $126,600 | $149,400 |
| 2018 | $5,265 | $254,700 | $109,200 | $145,500 |
| 2017 | $5,212 | $249,400 | $109,200 | $140,200 |
| 2016 | $4,936 | $251,300 | $98,200 | $153,100 |
| 2015 | $4,549 | $238,400 | $94,300 | $144,100 |
| 2014 | $4,364 | $232,500 | $94,300 | $138,200 |
Source: Public Records
Map
Nearby Homes
- 6 E Division St
- 373 N Franklin St
- 16 Woodcliff Rd
- 104 Milton Rd
- 187 Belcher St
- 1501 Liberty St
- 29 Woodedge Ave
- 61 Woodside Ave
- 5 Clarendon Cir Unit Lot 4
- 27 Winter St
- 16 Winthrop Ave
- 63 Cedarhill Rd
- 22 Medallion Rd
- 96 Roberts Ave
- 44 Arlington Ave
- 30 Bradford Commons Ln
- 152 S Franklin St
- 1579 Washington St
- 175 Tyson Commons Ln
- 134 Tyson Commons Ln